Diffusion of Innovations
How Things Spread in Networks
What Is Diffusion?
Diffusion is the spread of objects, ideas, information, concepts, fashions, tastes, or practices within a social network.
The process has five components:
- Innovation: the object that diffuses
- Actors: the people or groups that adopt, or fail to adopt, the innovation
- Flow: movement of the innovation from a source actor to an adopting actor
- Mechanism: the process linking sources and adopters, such as imitation, contact, proximity, influence, or comparison
- Outcome: the end state of the adopter, such as opinion change, conversion, participation, or infection
Why Do Things Diffuse?
Three factors account for why some things spread and others do not.
- The object: familiar, low-risk innovations with a favorable cost-benefit ratio diffuse more easily
- The source and adopter: people adopt from high-status sources, or from those they see as similar to themselves
- The environment: geographic or social proximity, shared social foci such as workplaces or clubs, and overall network structure
Four Network Models of Diffusion
- Direct cohesion: the connectivity of adopters to their sources through network ties
- Two-step: the social distance between adopters and influential sources, and the traits of those influentials
- Threshold: the susceptibility of adopters to the behavior of multiple sources
- Positional equivalence: indirect influence and comparison between sources and structurally similar adopters
Diffusion via Cohesion
- The simplest model: innovations “travel” along direct network links
- The main mechanism is imitation, often driven by the similarity heuristic: “I adopt the innovations that people like me adopt” (homophily)
- A second mechanism is contagion, where an innovation spreads like a virus, so more direct connections to adopters raise the chance of adopting
The Medical Innovation Study
Coleman, Katz, and Menzel (1957) followed doctors’ adoption of a new drug over about 15 months in four cities.
- The team mapped advice and discussion ties among doctors, and merged them with prescription records that fixed each doctor’s first prescription month
- Months 1–2: professional advice and discussion ties were most effective
- Months 3–4: friendship ties took over
- Months 4–5: the network reached less integrated, “isolated” doctors
- Months 6 and later: the network was exhausted, and late adopters relied on ads and salesmen instead
Two-Step Models
- Innovations reach opinion leaders first, and potential adopters then look to them for what to adopt
- Opinion leaders are visible, well-connected early adopters, such as celebrities or social media influencers
- Network terms for leaders: high degree (popular), high eigenvector centrality (connected to popular people), or high betweenness (bridging groups)
- The two-step model can combine with cohesion: leaders receive the innovation from a source, and then it spreads among adopters through their ties
Diffusion via Positional Equivalence
- Cohesion models assume influence flows only between connected actors
- Diffusion can also operate between disconnected actors who occupy similar structural positions
- The mechanism is comparison: people adopt to keep their status or competitiveness relative to similarly positioned others
The S-Curve
Cumulative adoptions typically follow an S-shaped pattern with three phases:
- Initial slow uptake: early adopters and innovators take up the innovation while most of the population waits
- Rapid spread: adoption accelerates, and the number of new adopters per unit time peaks during the “take off” period
- Final slow saturation: adoption levels off as most potential adopters have joined
The S-Curve Shape
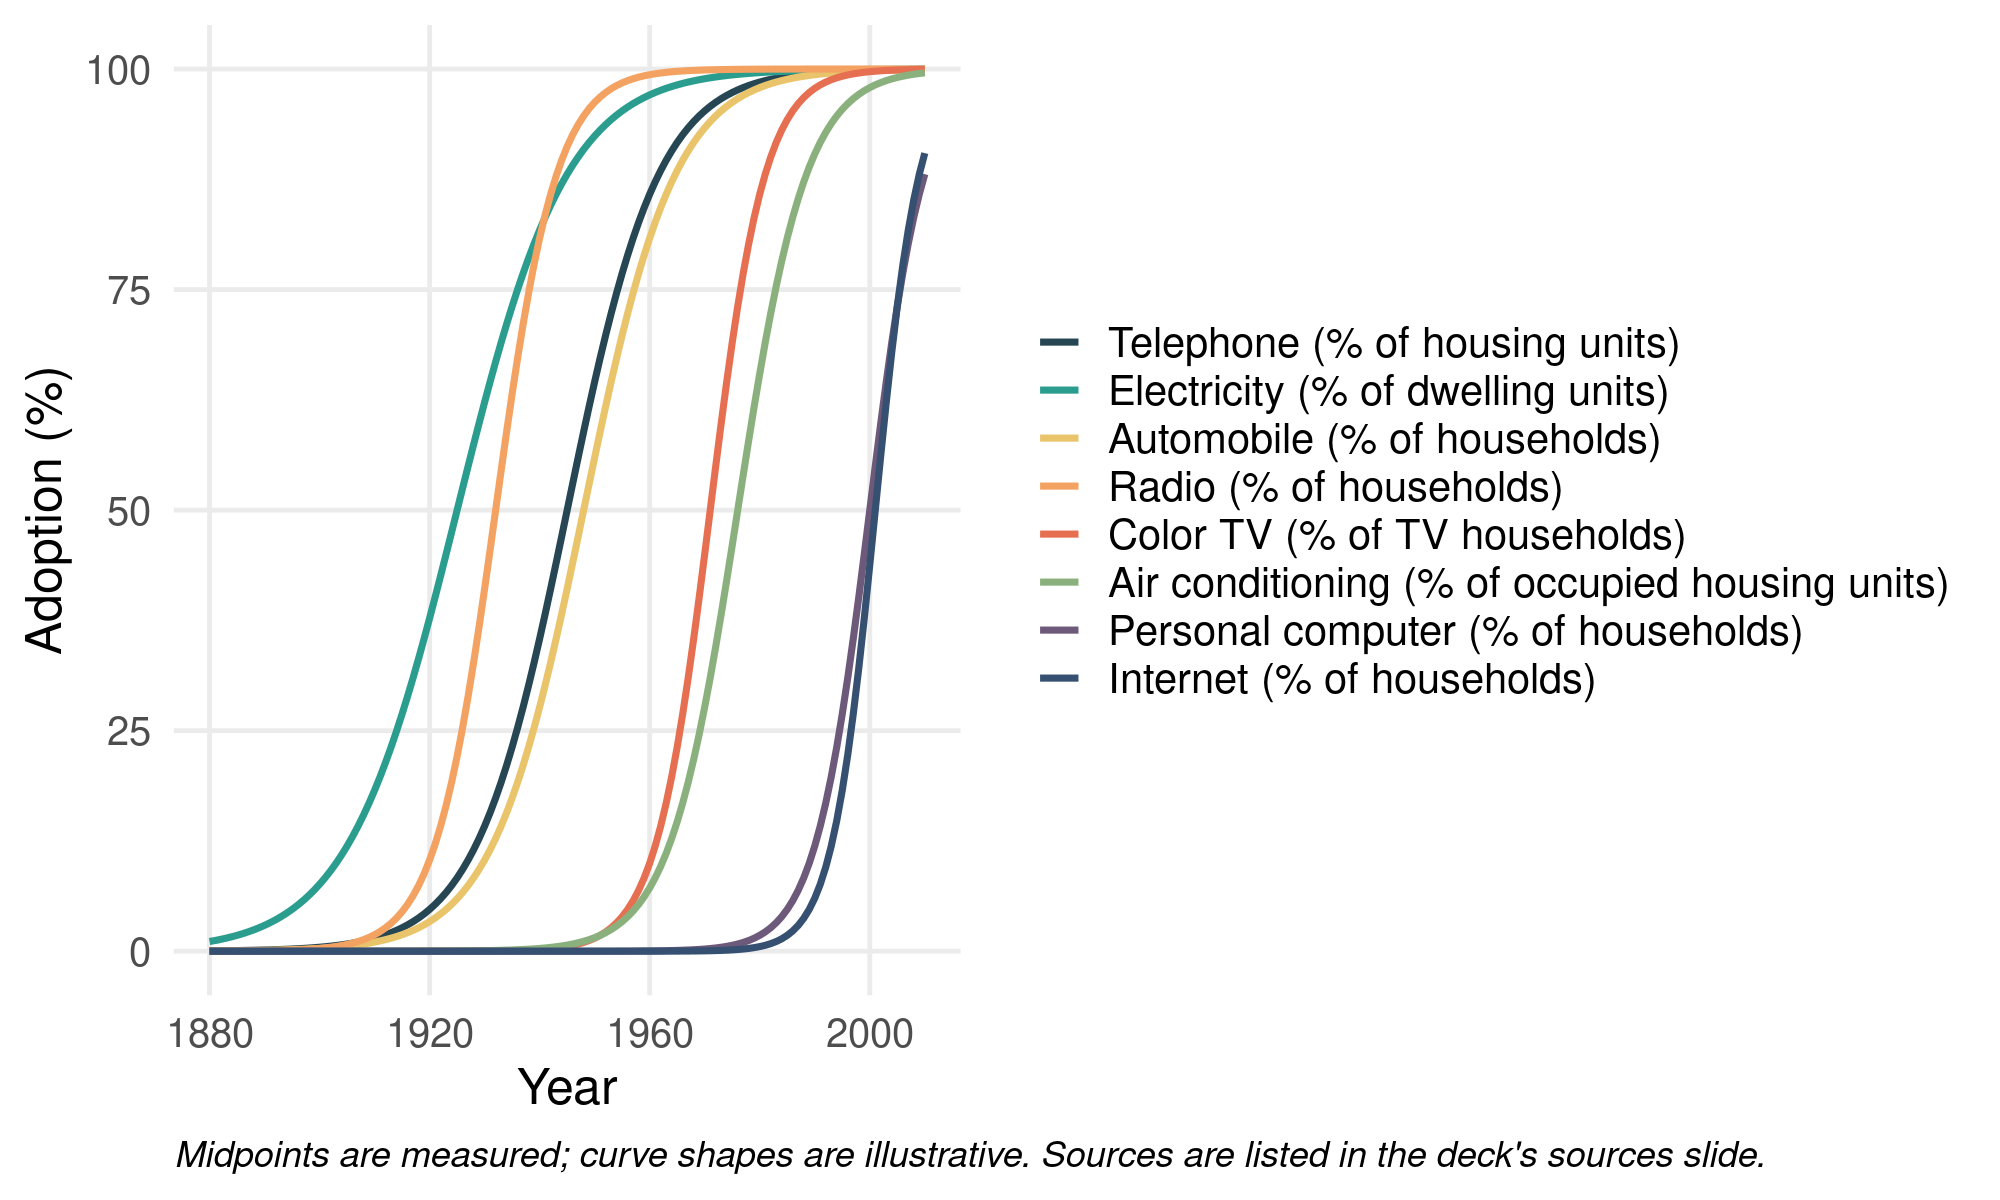
Measured 50% adoption midpoints; curve shapes are illustrative. Sources on the next slide.
Sources for the S-Curve Figure
| Technology | Midpoint | Measured points |
|---|---|---|
| Telephone | 1945 | 36.9% (1940), 61.8% (1950), Census |
| Electricity | 1925 | 34.7% (1920), 68.2% (1930), Census |
| Automobile | 1948 | 50% (1948) |
| Radio | 1932 | 40% (1930), 60% (1934) |
| Color TV | 1971 | 48% (1971), 50%+ (1972) |
| Air conditioning | 1976 | 35.8% (1970), 58.5% (1980) |
| Personal computer | 2000 | 51% (2000, CPS) |
| Internet | 2001 | 50.4% (2001, CPS) |
Denominators are in the figure legend. Cellphone is omitted: the Pew series starts at 62% of adults in 2002.
The Tipping Point
- The tipping point comes after early adopters and before the early majority fully engage
- Innovations that never reach it often die out
- Many historical innovations, from electricity to the VCR to the internet, follow the S-shaped pattern
- Social movements can show a long uptake period followed by rapid mobilization
Global Threshold Model
Granovetter and Soong (1983) proposed that each person has a threshold \(q(i)\), with \(0 < q(i) < 1\).
- Person \(i\) adopts when the proportion of people who have adopted, \(p\), reaches \(q(i)\)
- A person with \(q = 0.25\) adopts once a quarter of the population has adopted; one with \(q = 0.75\) waits until three quarters have
- The model assumes everyone knows the population-wide adoption rate, which fits public, observable behaviors
Thresholds Explain the S-Curve
- Slow start: only people with very low thresholds adopt
- Rapid spread: when thresholds cluster in the middle, the majority joins
- Slow finish: only people with high thresholds remain
The shape of the threshold distribution matters. A distribution skewed toward risk-averse late adopters makes full diffusion less likely. One with plenty of high-risk early adopters makes it more likely.
Rogers’s Classification of Adopters
Rogers (1962) groups adopters by their time of adoption relative to the average.
| Category | Share of adopters | Timing |
|---|---|---|
| Innovators | 2.5% | More than 1 SD before average |
| Early adopters | 13.5% | More than 1 SD before average |
| Early majority | 34% | Within 1 SD before average |
| Late majority | 34% | Within 1 SD after average |
| Laggards | 16% | More than 1 SD after average |
Early adopters are the opinion leaders who influence the early majority. Failed innovations die before reaching the tipping point.
Valente’s Network Threshold Model
- Granovetter’s model assumes global knowledge; Valente’s model uses each person’s local network
- Each person has an exposure \(e(i)\), the proportion of their friends who have adopted
- A person adopts when \(e(i)\) reaches their personal threshold \(q(i)\)
- In the textbook example, a person with \(q = 0.25\) adopts after one of three friends does, while a person with \(q = 0.75\) waits until three of four friends have adopted
Valente’s Four Types of Adopters
Two thresholds, personal and whole-network, yield four types:
- True innovators (influentials): low personal and low whole-network thresholds
- Isolates: low personal threshold, high whole-network threshold
- Connected bandwagon: high personal threshold, low whole-network threshold
- Resistant rearguard: high personal and high whole-network thresholds, largely matching Rogers’s laggards
Adopter categories can also be relative. You can be an innovator in the system and a laggard among your friends, or the reverse.
Local and Cosmopolitan Diffusion
- Cosmopolitan innovators tend to be early adopters relative to the system, with low thresholds relative to their own network
- They often adopt through media or weak ties
- Late adopters often rely on friends and strong ties
Simplex and Complex Contagion
| Feature | Simplex | Complex |
|---|---|---|
| Threshold | Low; one exposure often enough | High; multiple sources needed |
| Risk or cost | Low | High; risk, ostracism, or resource loss |
| Primary ties | Weak ties (bridges) | Strong ties (cliques) |
| Information | Simple, novel | Complex, interdependent |
Information, gossip, and disease are candidates for simplex contagion. Social movement participation, religious conversion, and migration are candidates for complex contagion.
Which Ties Speed Diffusion?
- Simplex contagion can spread faster through weak ties, which bridge otherwise separate parts of a network (Granovetter 1973)
- Complex contagion can spread faster through cliques and strong ties, because it needs repeated reinforcement
- Weak ties carry an innovation across a bridge only once, so they often fail to supply the multiple exposures complex contagion requires
Key Takeaways
- Diffusion follows an S-shaped path, with slow uptake, rapid spread, and saturation
- Direct cohesion, two-step, threshold, and positional models each explain a different part of that path
- Whether an innovation spreads through weak bridges or strong cliques depends on whether it is simple or complex to adopt
- Local networks can explain adoption patterns that global models cannot