The Strength of Weak Ties
Granovetter’s Theory of Social Bridges, Local Density, and Information Bandwidth
Form vs. Content in Social Relations
- In everyday life, we tend to categorize relations by their content:
- Kin (parent, sibling), Friends (best friend, work friend), Romantic partners, or activity-based groups (workout buddies, gaming crew).
- Network Analysis abstracts away from content to study the form of social relations:
- Tie Strength (intensity) is a formal property that cuts across different contents.
- For example, you can have a coworker (content) with whom you interact daily (frequency, form) or a sibling (content) whom you rarely see (frequency, form).
- Formal properties allow us to build generalizable theories of social structure.
What is a Social Tie? (States vs. Events)
Social network researchers classify ties into two major clusters (Borgatti et al., 2009):
1. States (Static Situations)
- Similarities: Demographic overlaps, shared group memberships, or spatial proximity.
- Relations: Kinship roles (parent-child), organizational roles (boss-employee), or affective/cognitive states (liking, trusting).
2. Events (Processes in Time)
- Interactions: Discrete, temporal behavioral events (talking, working together, helping move).
- Flows: The transmission of physical or intangible items (information, money, disease).
Connection to Tie Strength:
- Tie strength represents an affective/role state that is built, maintained, and indicated by temporal events (interaction frequency and flow of support).
Caveats of Tie Strength: Correlation vs. Identity
- Rule 1: Multiple indicators are required
- Having only one property is not sufficient to qualify a tie as strong.
- Counter-Example 1 (High frequency, Low intimacy): You see a coworker you hate every single weekday. This is high interaction frequency (event), but low intimacy or sentiment. The tie is weak (or even negative!).
- Counter-Example 2 (Low frequency, High intimacy): You confide an intimate secret to a casual acquaintance. This is a one-time confiding event, but lacks duration and frequency. The tie remains weak.
- Rule 2: Tie types are correlations, not identities
- Kin ties or similar-race ties are expected to be strong, but they do not have to be.
- Example: You can be estranged from a parent or sibling (kin role is a state, but interaction events are zero).
- Role relations and similarities are predictors of tie strength, not identical to tie strength itself.
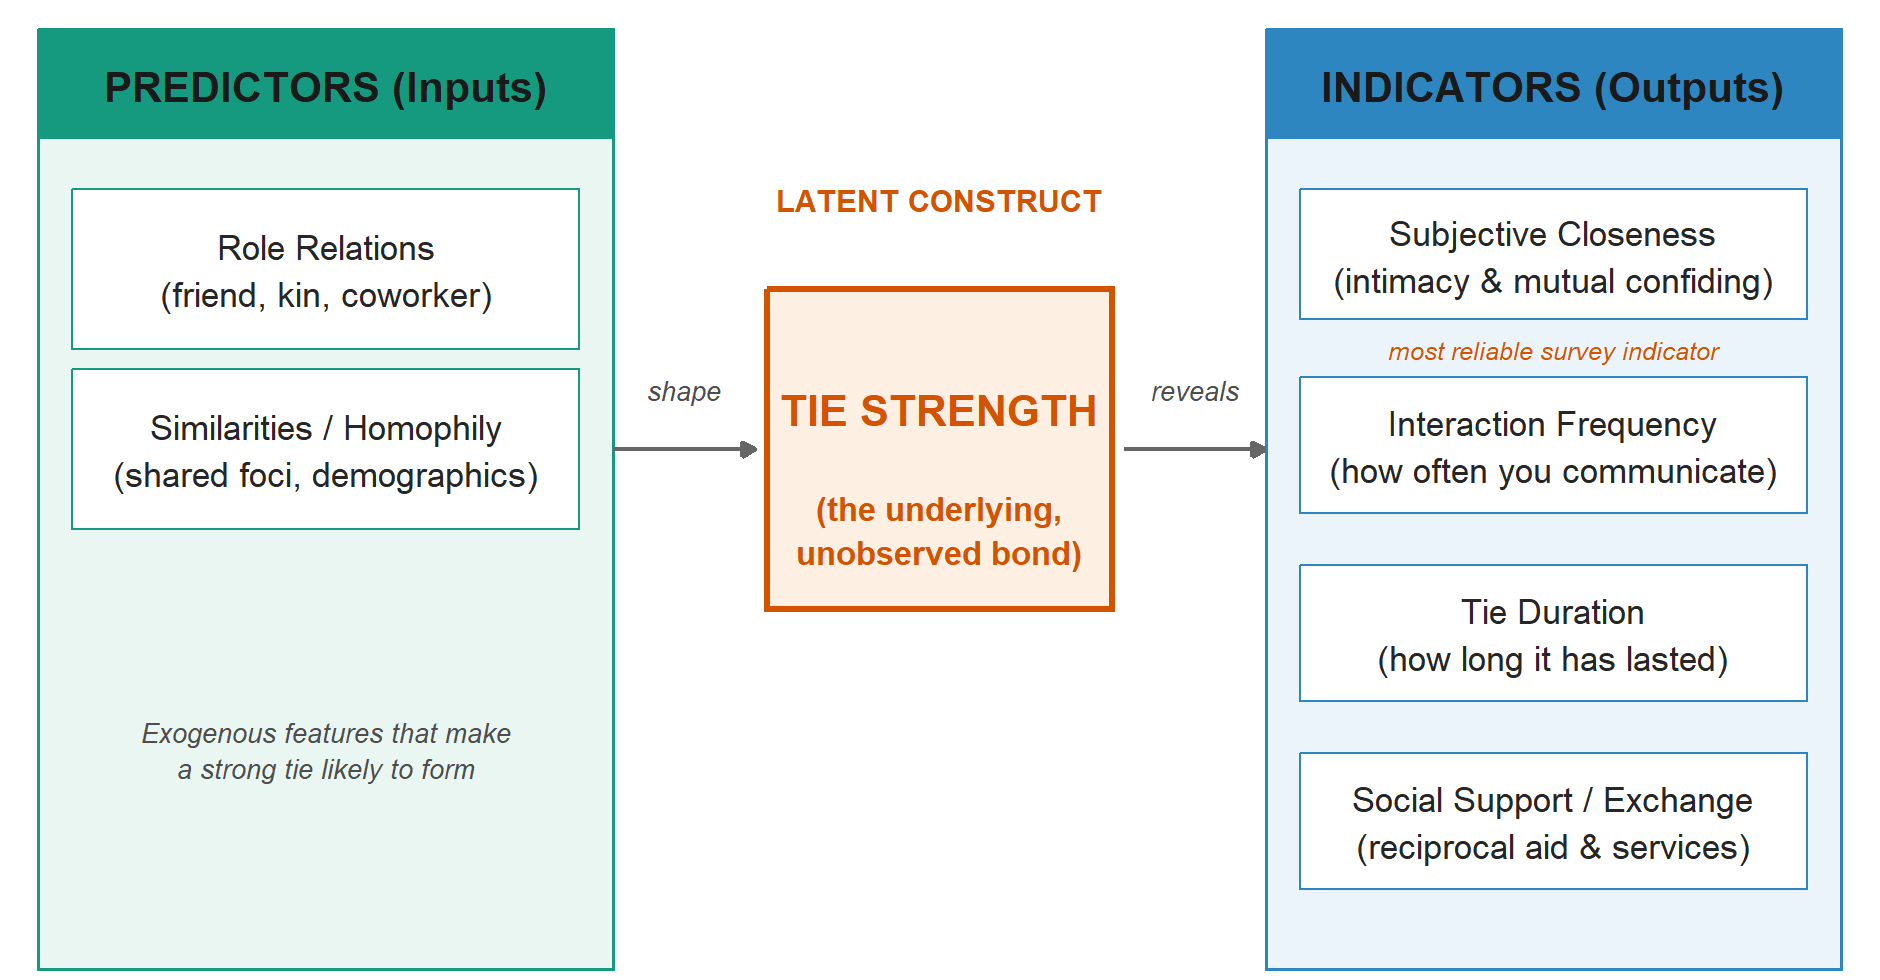
Measuring Tie Strength: Predictors
Measuring Tie Strength: Indicators
- Indicators (Outputs):
- Characteristics that reveal how strong an existing bond actually is.
- Subjective Closeness: The degree of mutual confiding and intimacy. This is considered the most reliable survey indicator of tie strength.
- Interaction Frequency: How often individuals communicate.
- Tie Duration: How long the relationship has lasted.
- Exchange/Social Support: Reciprocal services, resources, or aid.
- Core Recommendation:
- Do not rely on single proxies (like role or frequency). A robust measurement should combine multiple indicators.
Marsden & Campbell’s Predictors and Indicators Model
![]()
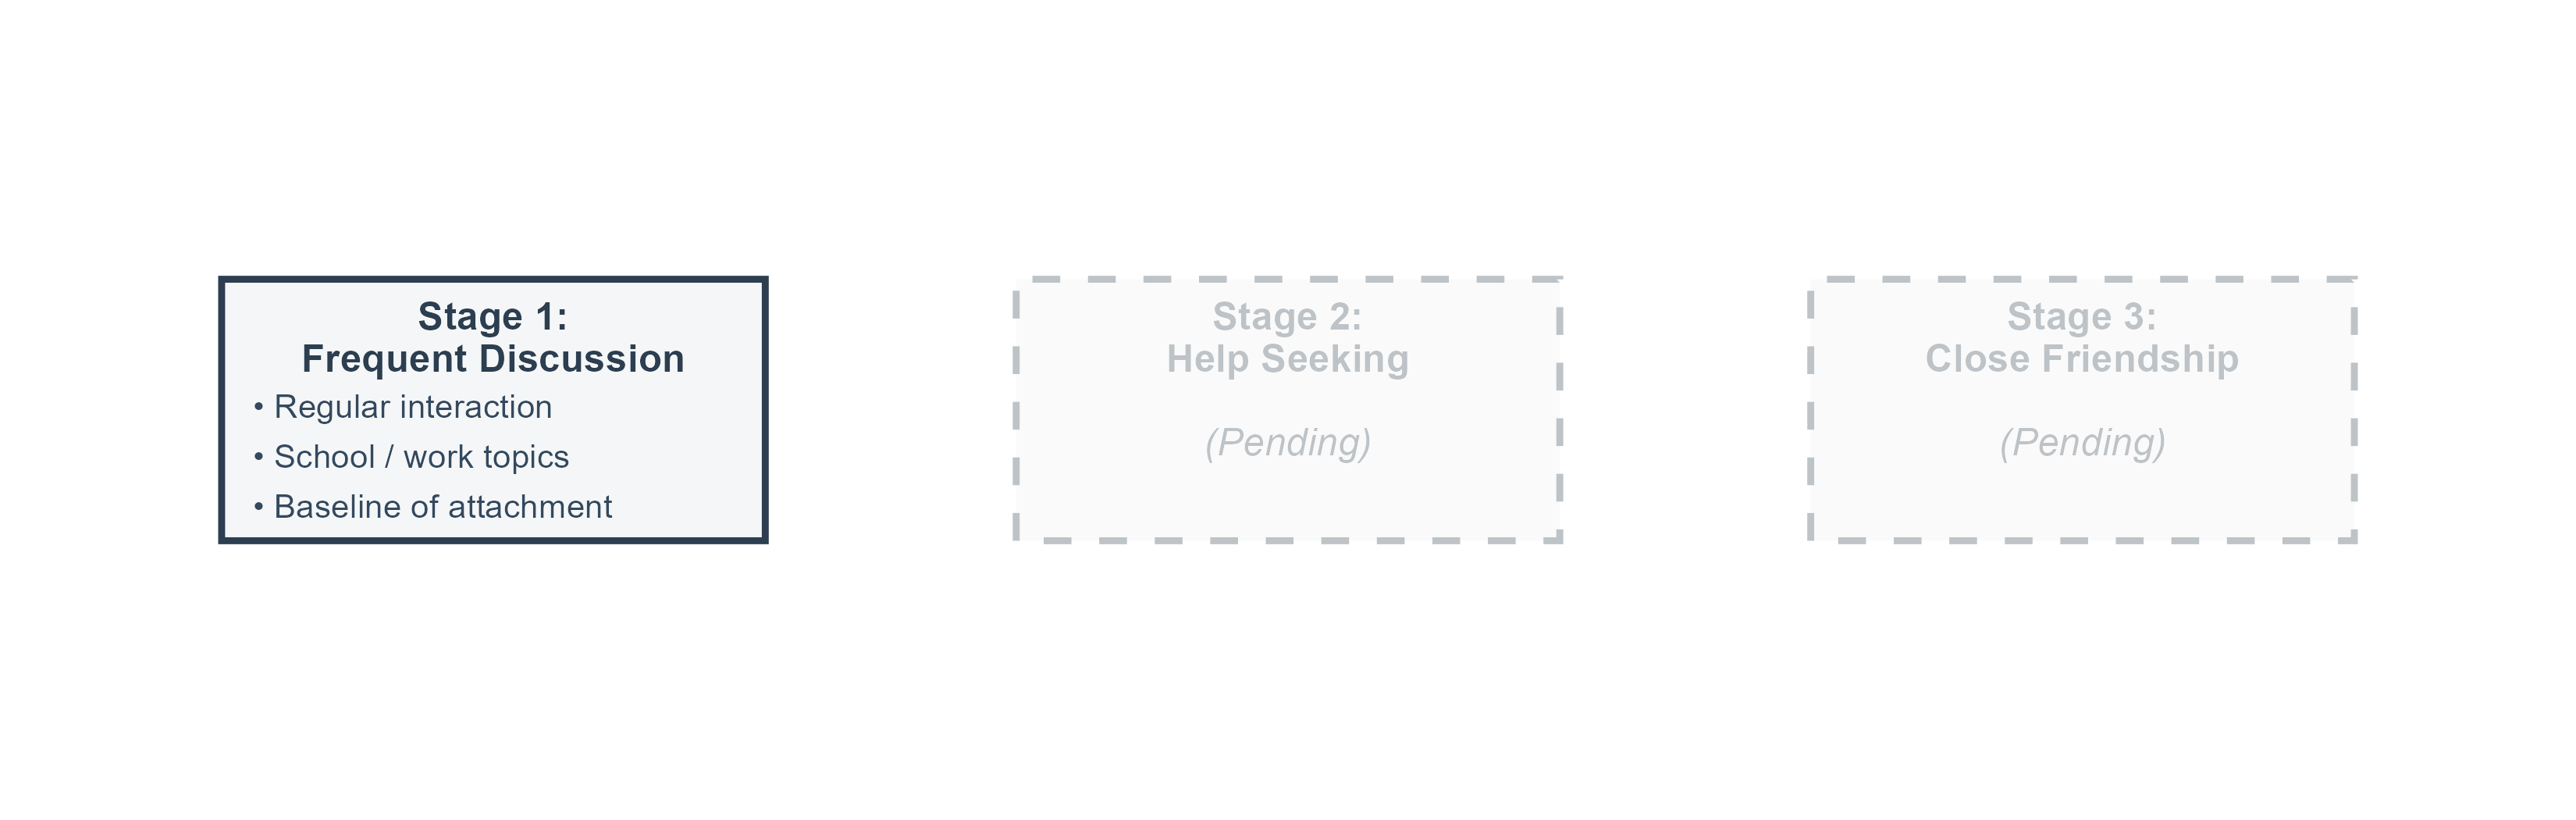
Stage 1: Frequent Discussion (The Baseline)
- Definition: Regular interaction and communication regarding daily, academic, or professional matters.
- The Structural Role:
- This forms the interactional baseline of attachment.
- Before trust, emotional safety, or intimacy can develop, there must be a routine history of contact.
- Indicators: High interaction frequency, shared spatial proximity, and joint participation in social foci (workplace/school).
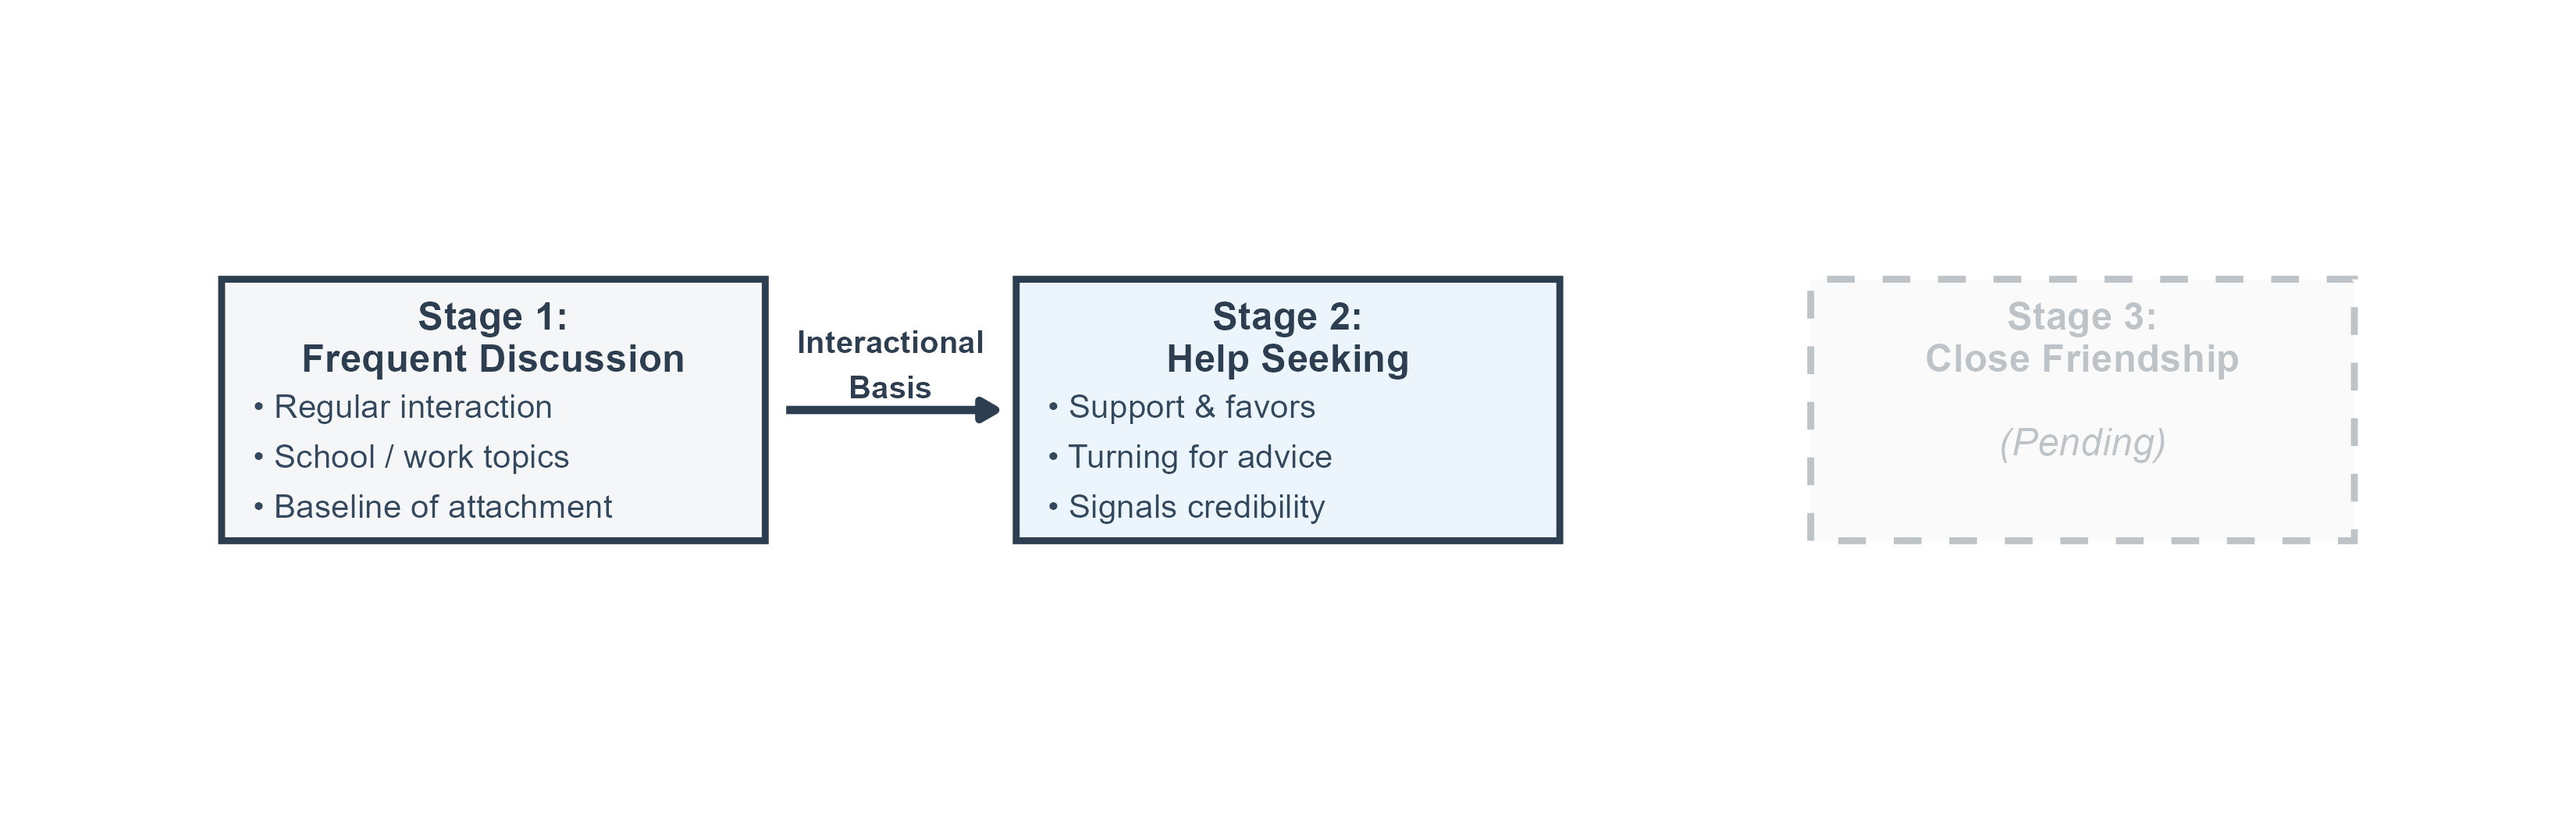
Stage 2: Help Seeking (Advice & Support)
- Definition: Turning to the other actor for information, favors, resources, or specialized advice.
- The Structural Role:
- Asking for assistance requires a pre-existing interactional history (Stage 1).
- It signals emerging trust and credibility—you do not ask someone you do not interact with or respect for favors or confidential advice.
- Indicators: Flow of reciprocal services, active mutual aid, and initial confiding.
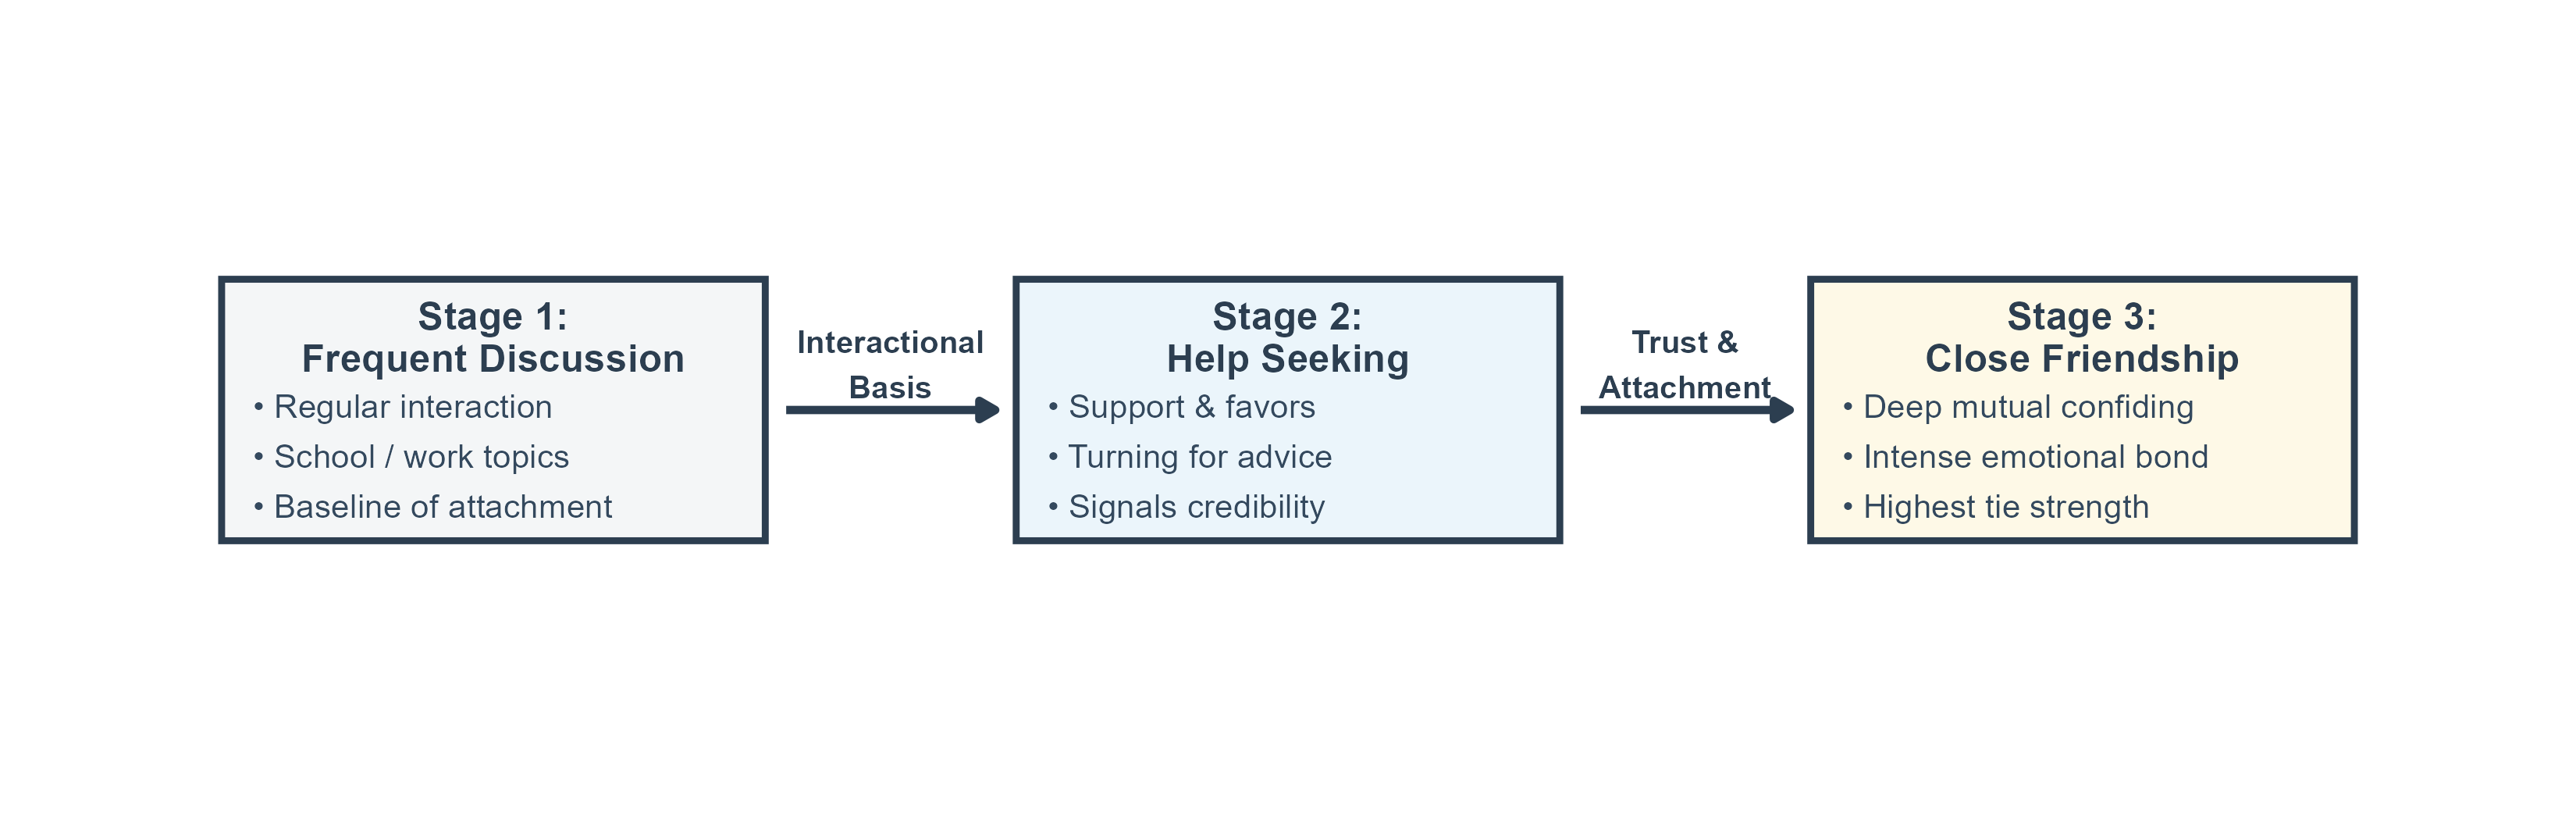
Stage 3: Close Friendship (Affective Bond)
- Definition: A subjective claim of an intimate, deep emotional bond and mutual confiding.
- The Structural Role:
- Deeper friendship represents the emotional peak of tie strength.
- It presupposes both a baseline of regular contact (Stage 1) and a history of mutual support and aid (Stage 2).
- Indicators: High subjective closeness, intense emotional attachment, and mutual confiding.
Visualizing the Stage Model: Step 1
![]()
Visualizing the Stage Model: Step 2
![]()
Visualizing the Stage Model: Step 3
![]()
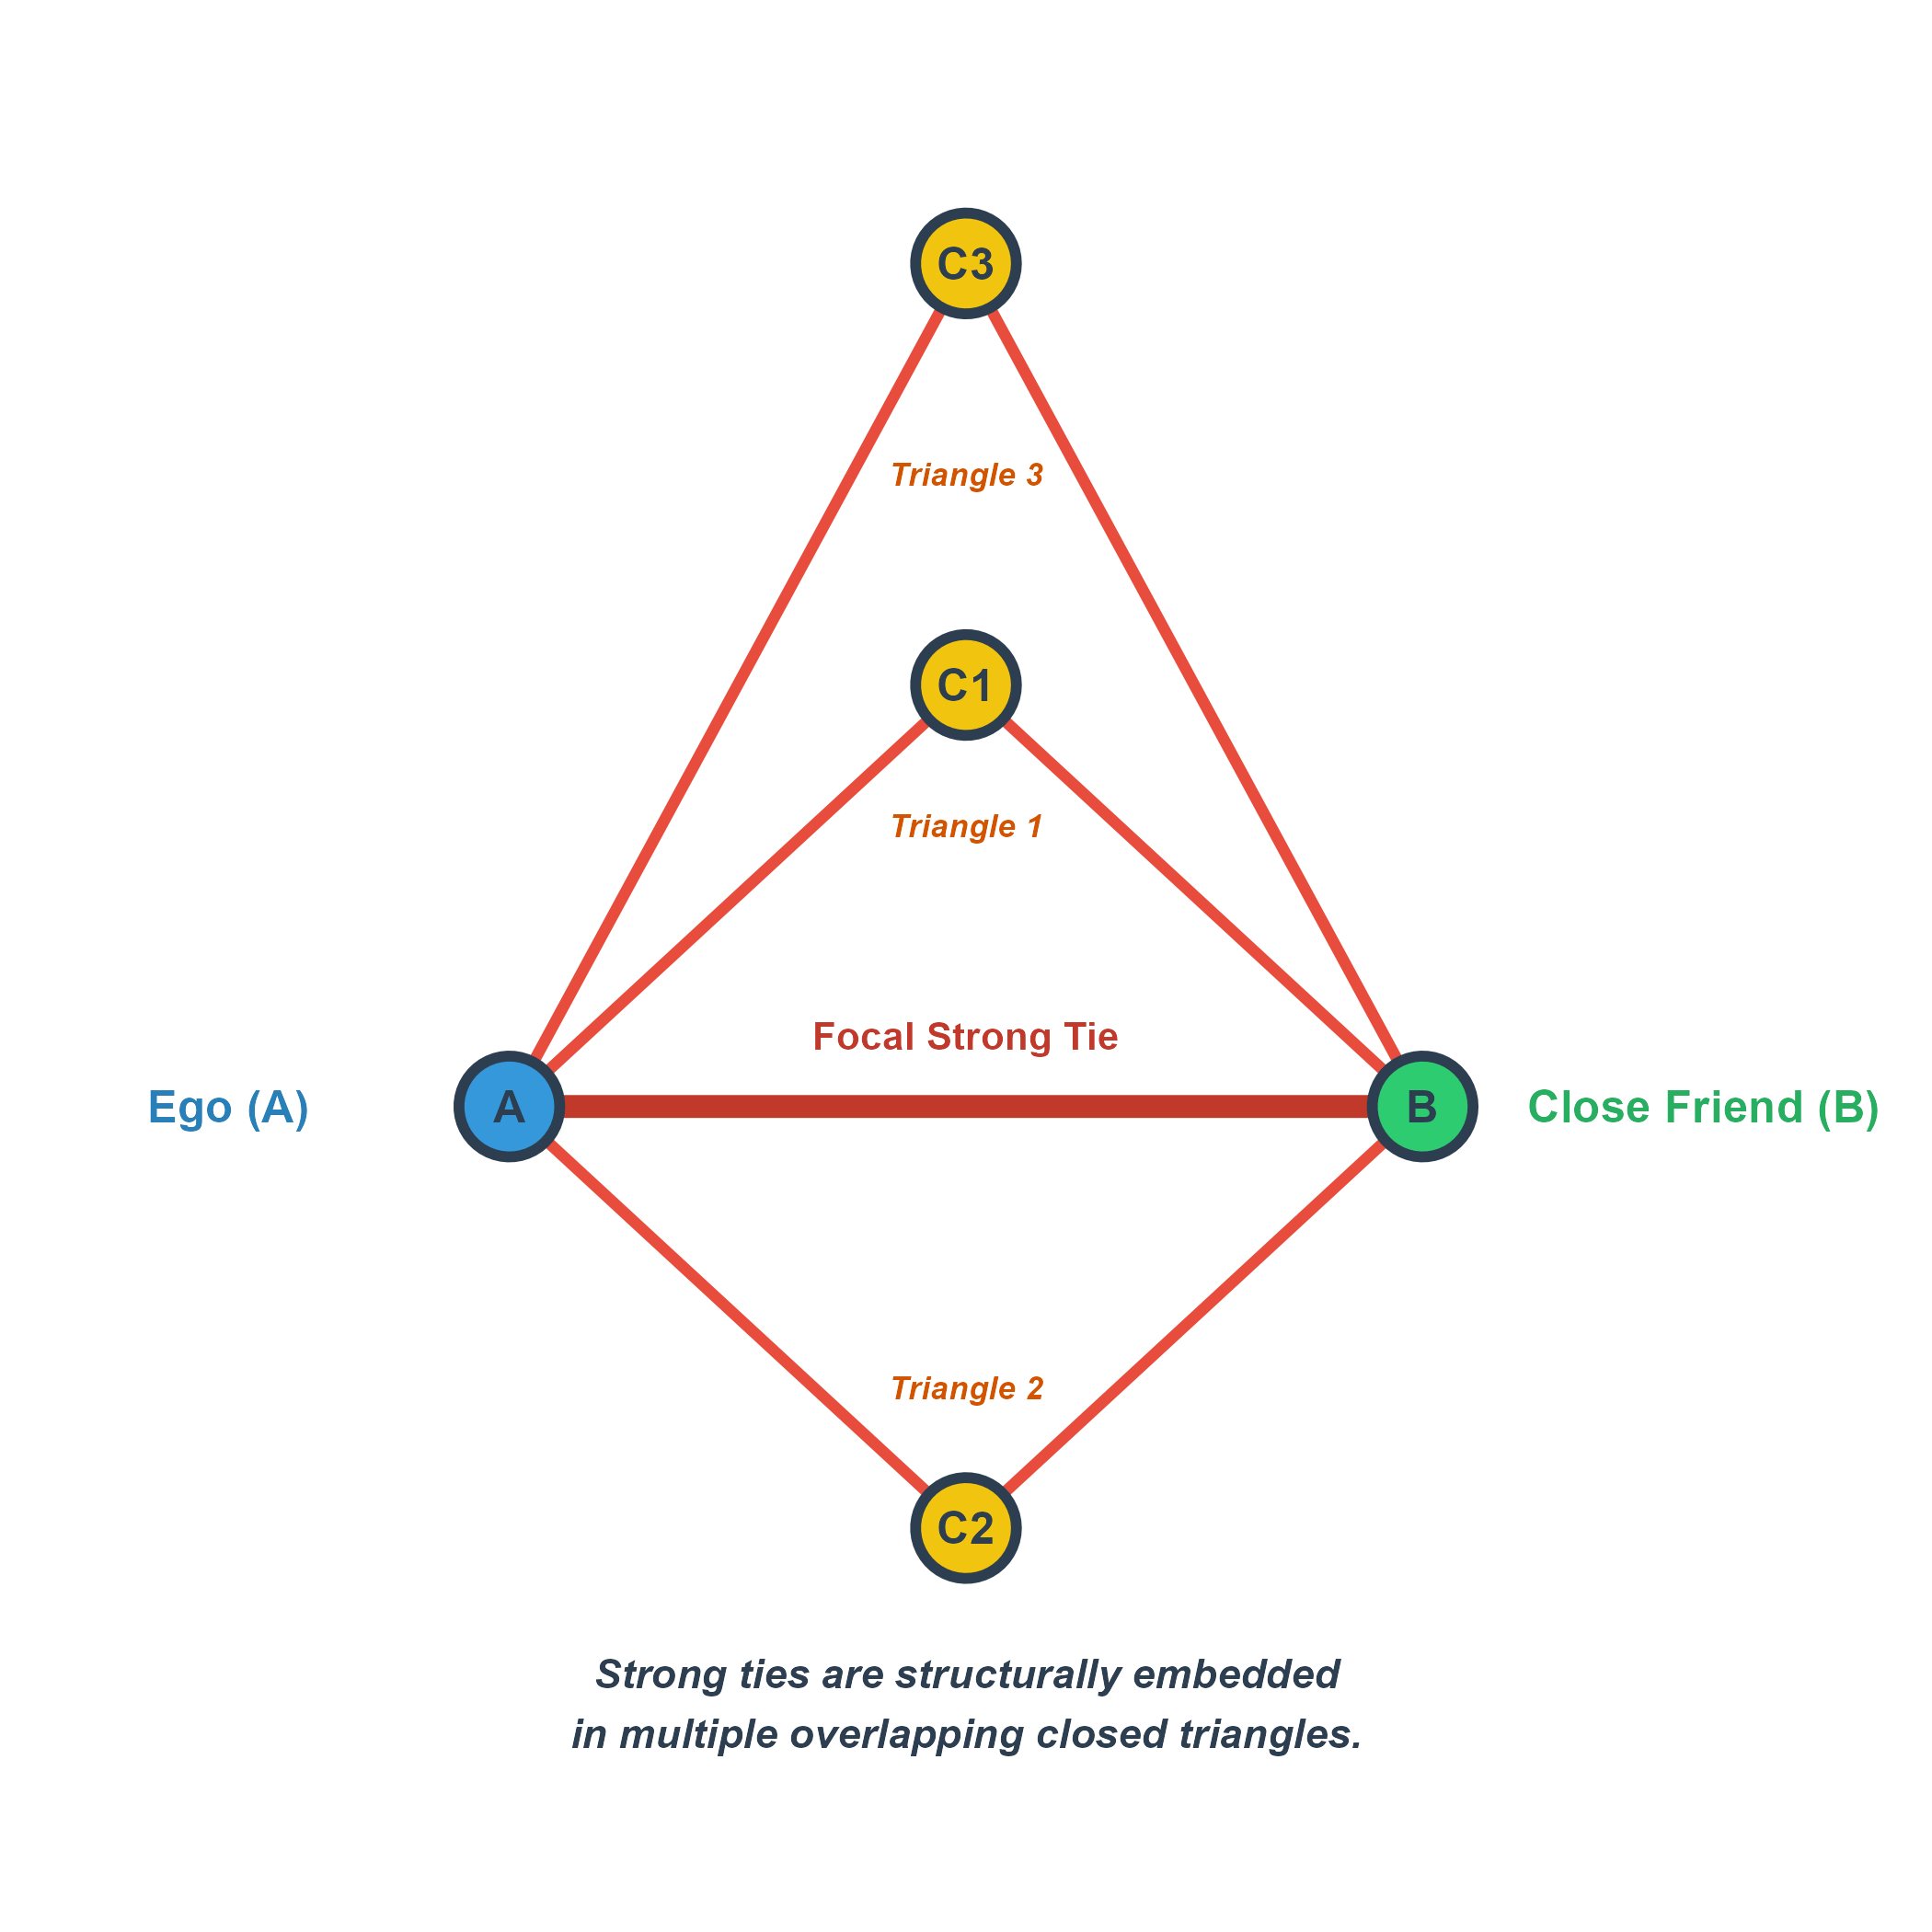
Granovetter-Transitivity: Rule 1 (Structural Embeddedness)
- Rule 1 (Shared Common Neighbors):
- If two people (Ego A and Friend B) are strongly connected, they tend to share many other friends in common.
- This embeds their relationship within multiple overlapping closed triangles.
- Implications:
- High local density of mutual connections.
- Fosters intense trust, collective memory, and rapid local communication.
- Creates a cohesive subgroup, but leads to highly redundant information.
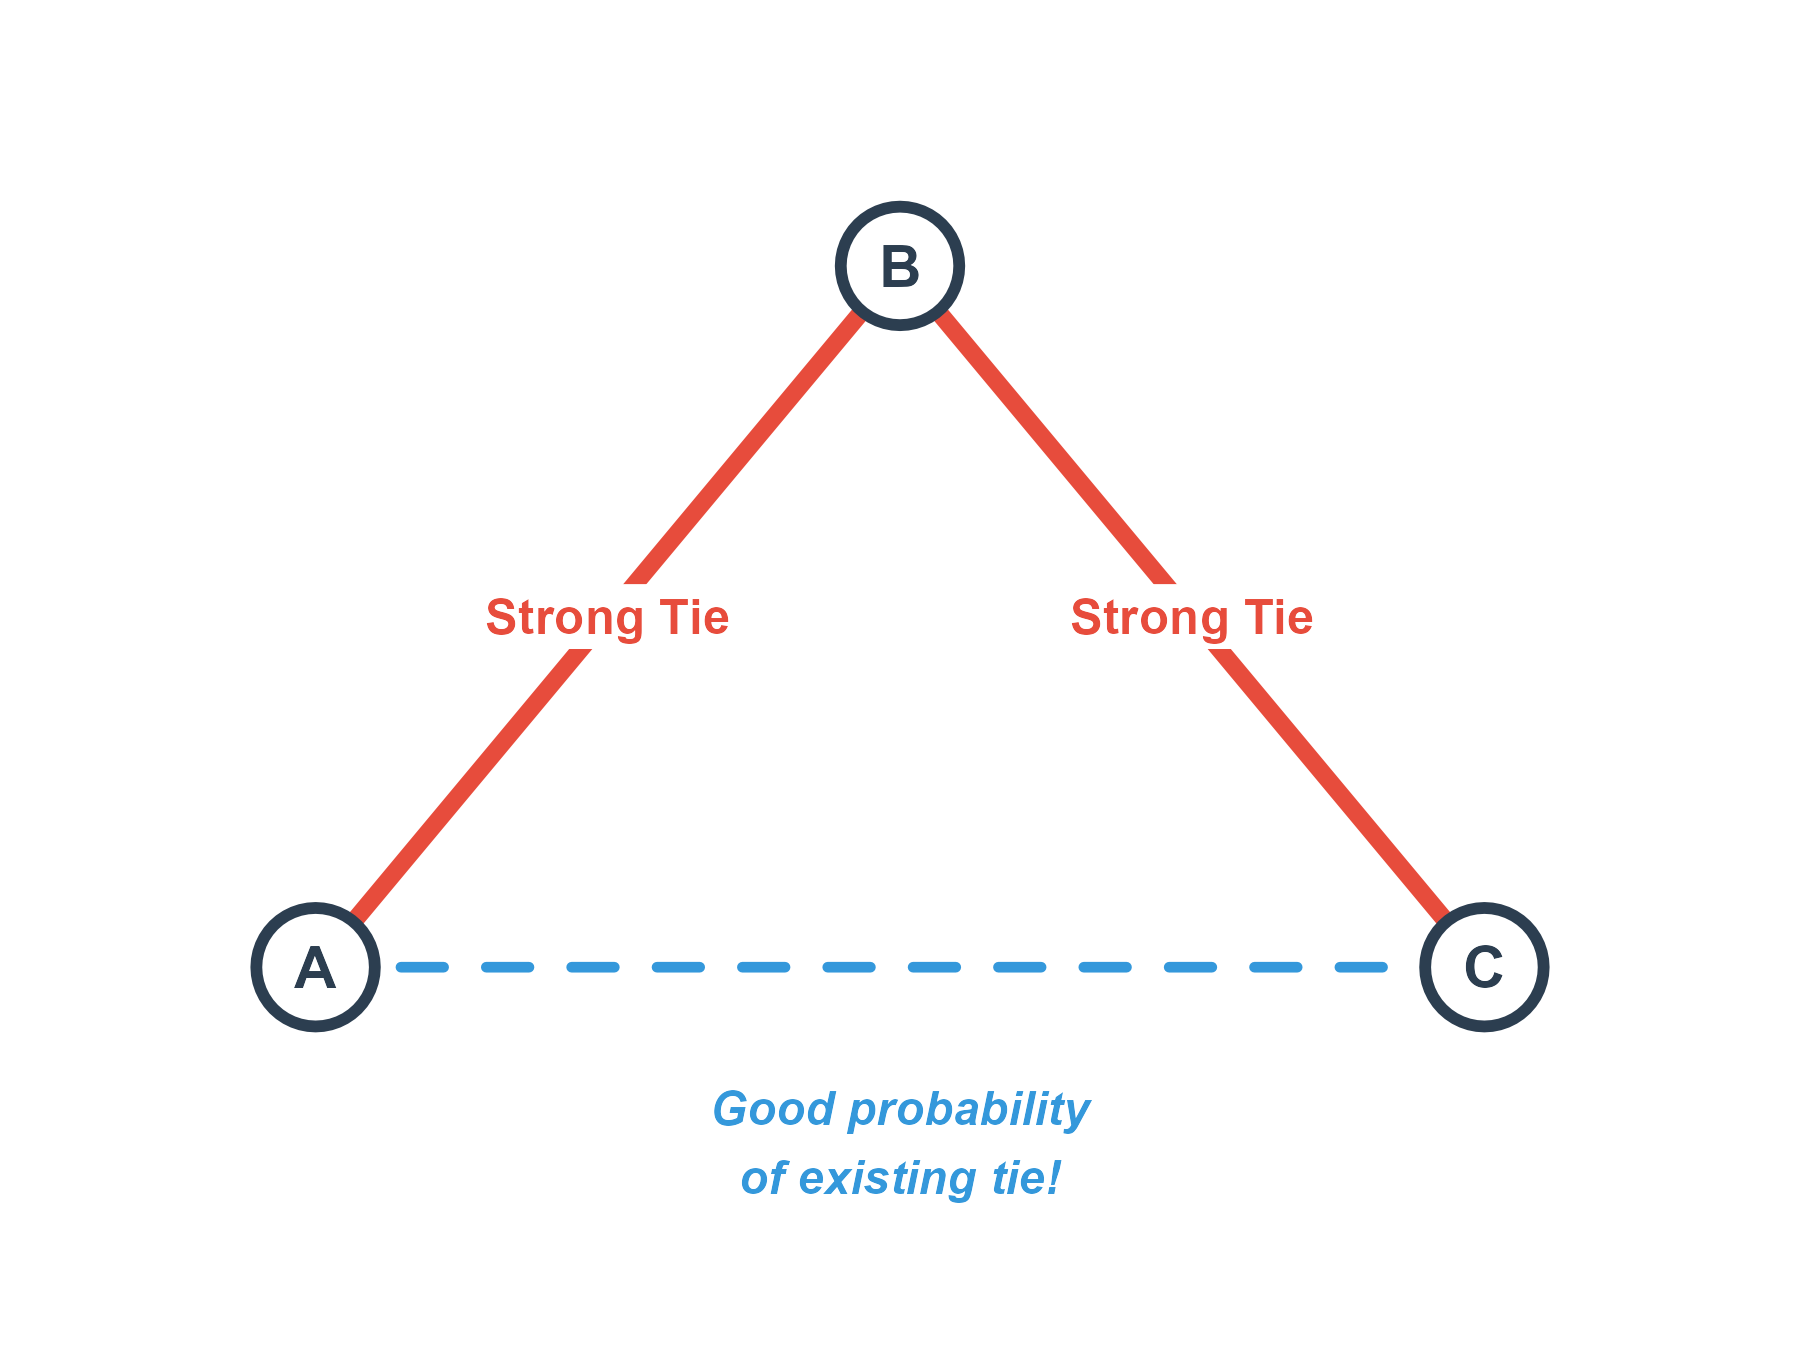
Granovetter-Transitivity: Rule 2 (Triadic Closure)
- Rule 2 (Triadic Closure):
- If Ego A has a strong tie to B, and B has a strong tie to C, there is a high probability of at least a weak tie forming between A and C.
- “A friend of a friend is (likely to be) a friend.”
- Mechanisms:
- Homophily: A, B, and C share similar demographics, traits, or values.
- Shared Foci: A, B, and C meet and interact in shared social contexts.
- Propinquity: Physical proximity.
The Weak Tie Principle
- The core of Granovetter’s theory rests on the weak tie principle:
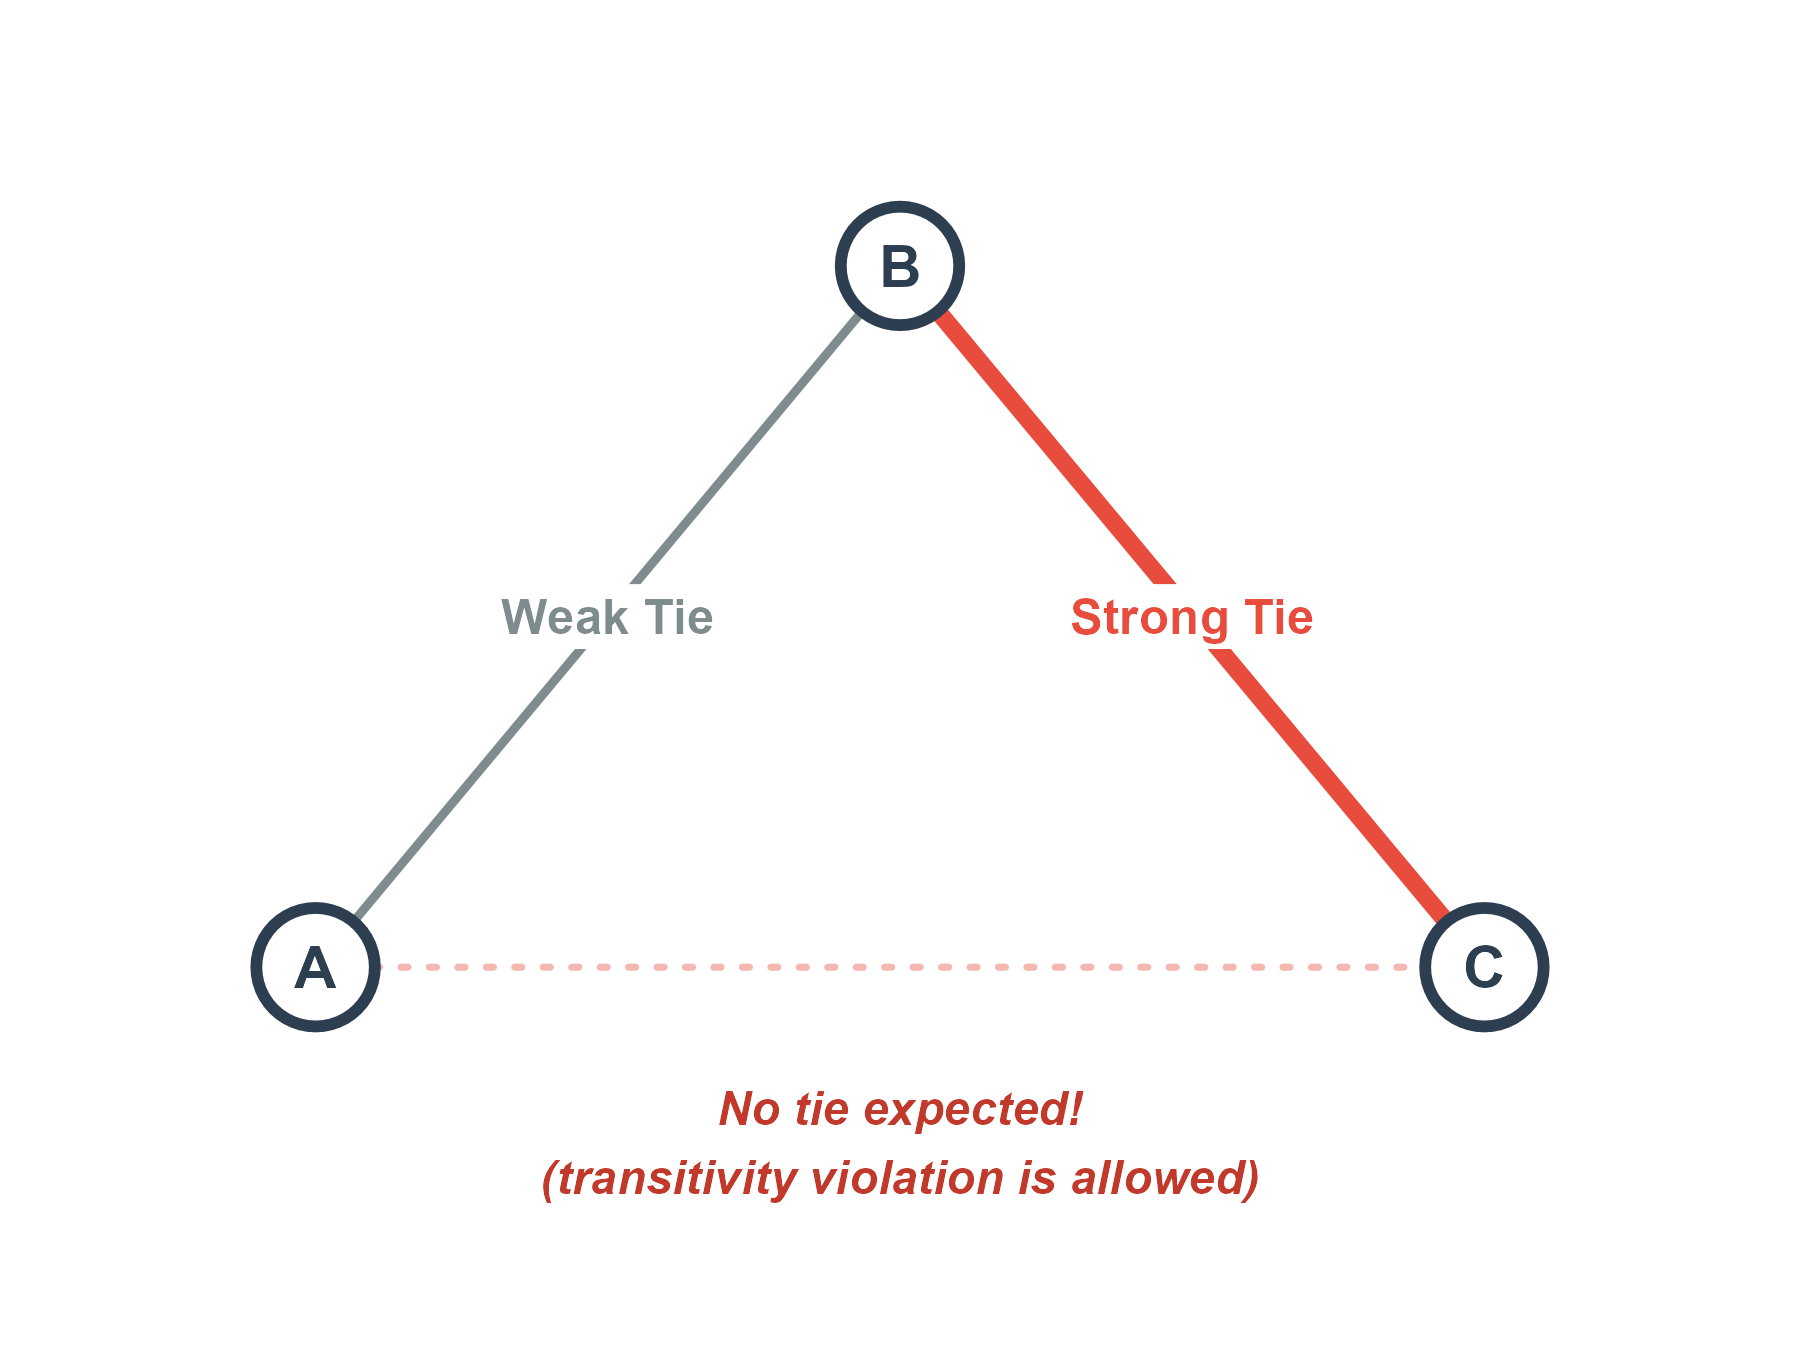
- Weak ties are valuable precisely because they allow violations of g-transitivity.
- If A has a weak tie to B, and B has a strong tie to C, there is a good probability of no tie between A and C.
- You do not need to be connected to everyone who is connected to your acquaintances.
- This allows weak ties to escape dense, redundant local clusters.
Weak Ties as Bridges
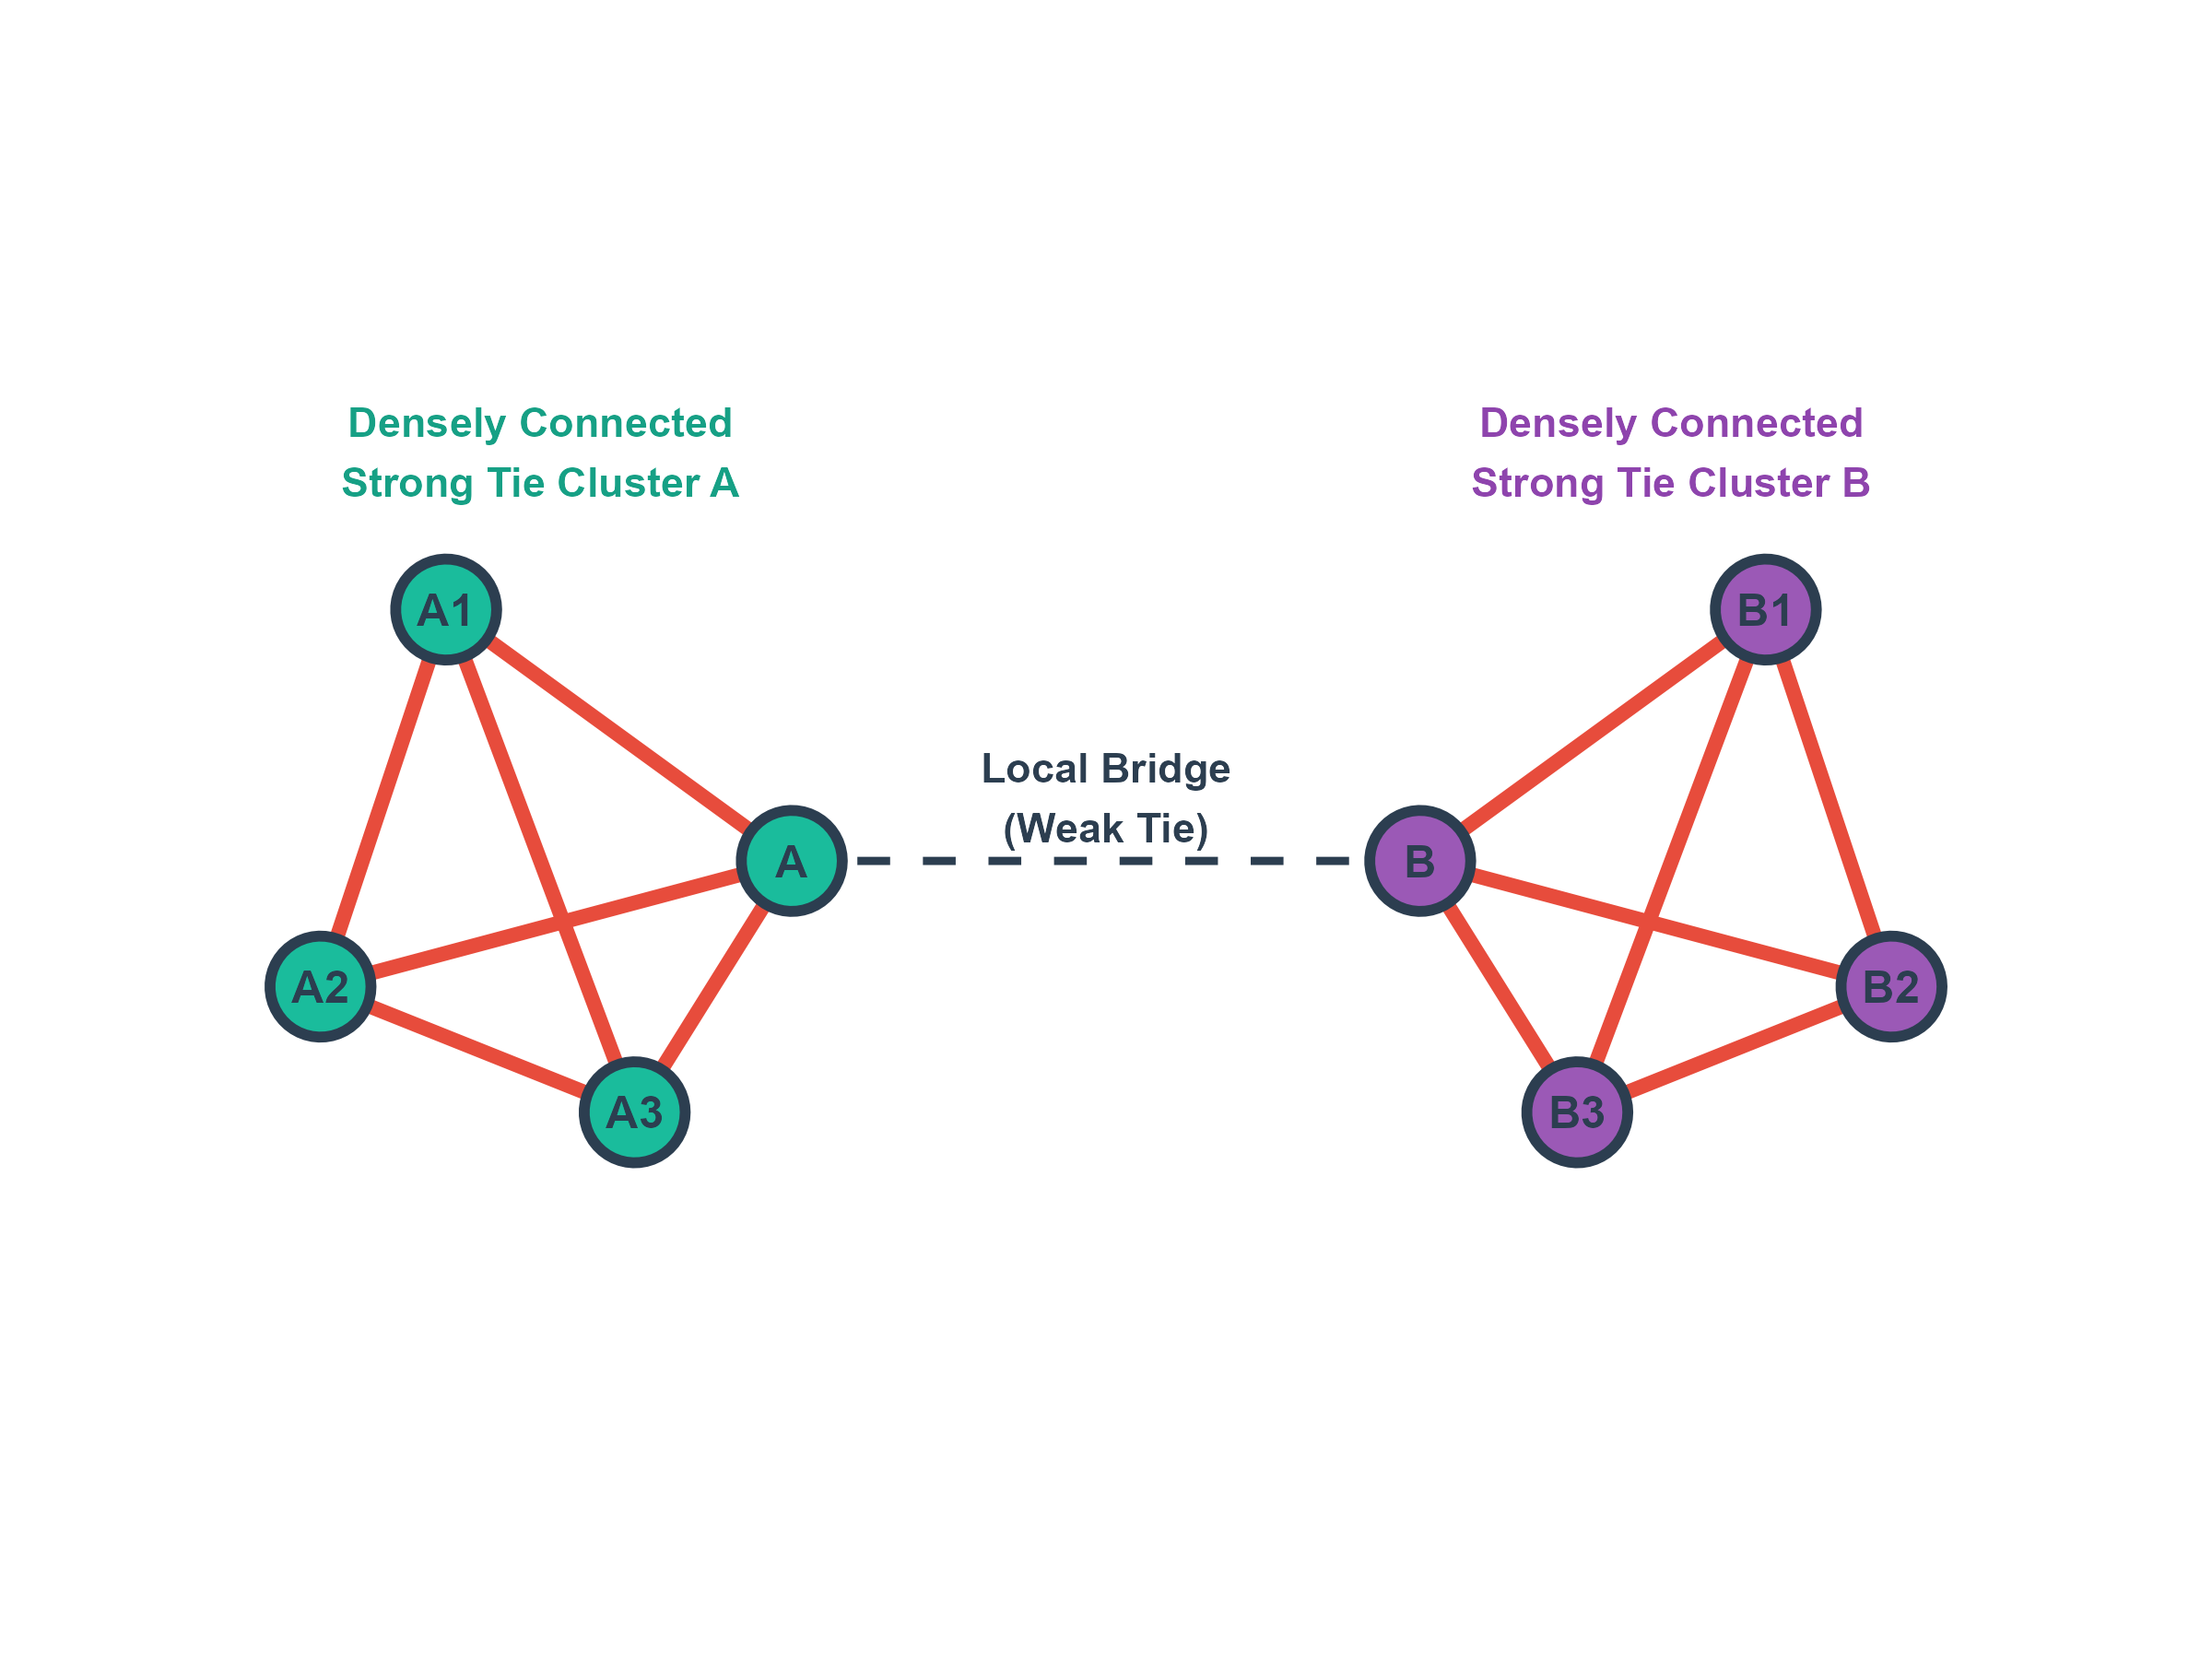
- Local Bridges & Brokerage:
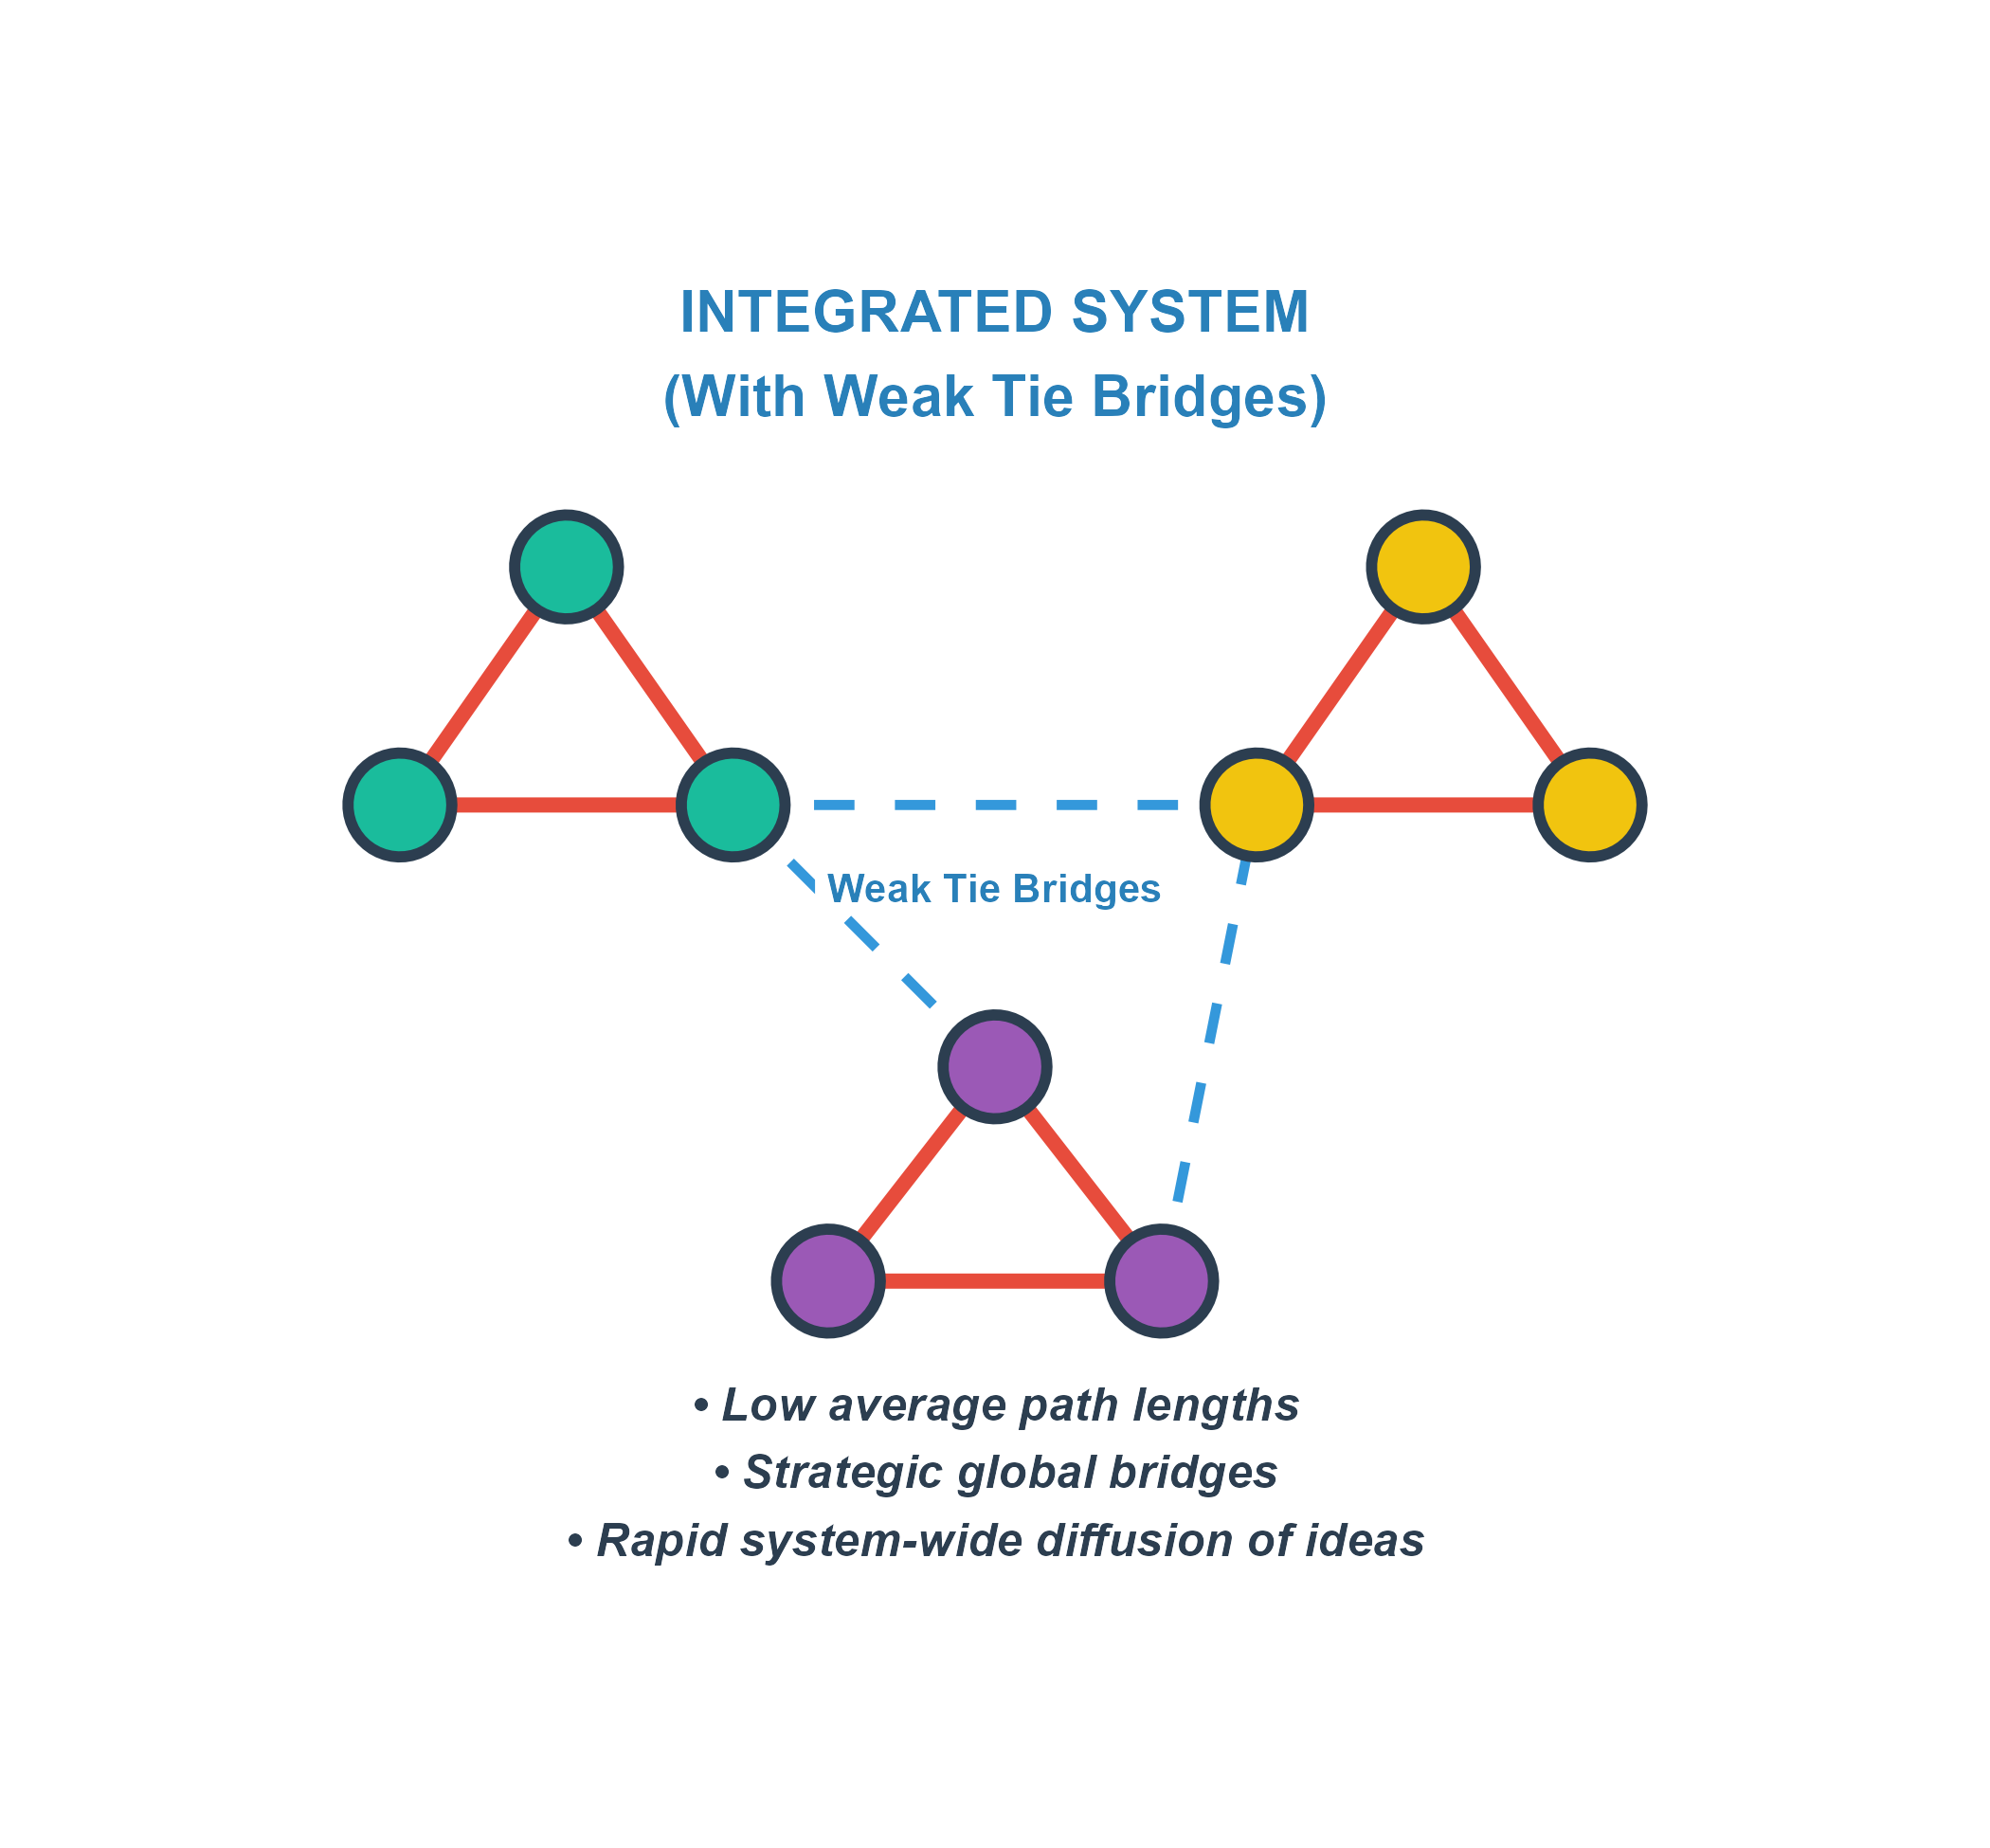
- Weak ties frequently function as bridges connecting otherwise isolated clusters of strong ties.
- The Information Tradeoff:
- Strong Ties (Redundancy): Due to g-transitivity, your close friends know the same people and same information.
- Weak Ties (Novelty): Because they violate transitivity, weak ties provide access to novel, non-redundant information from distant parts of the social structure.
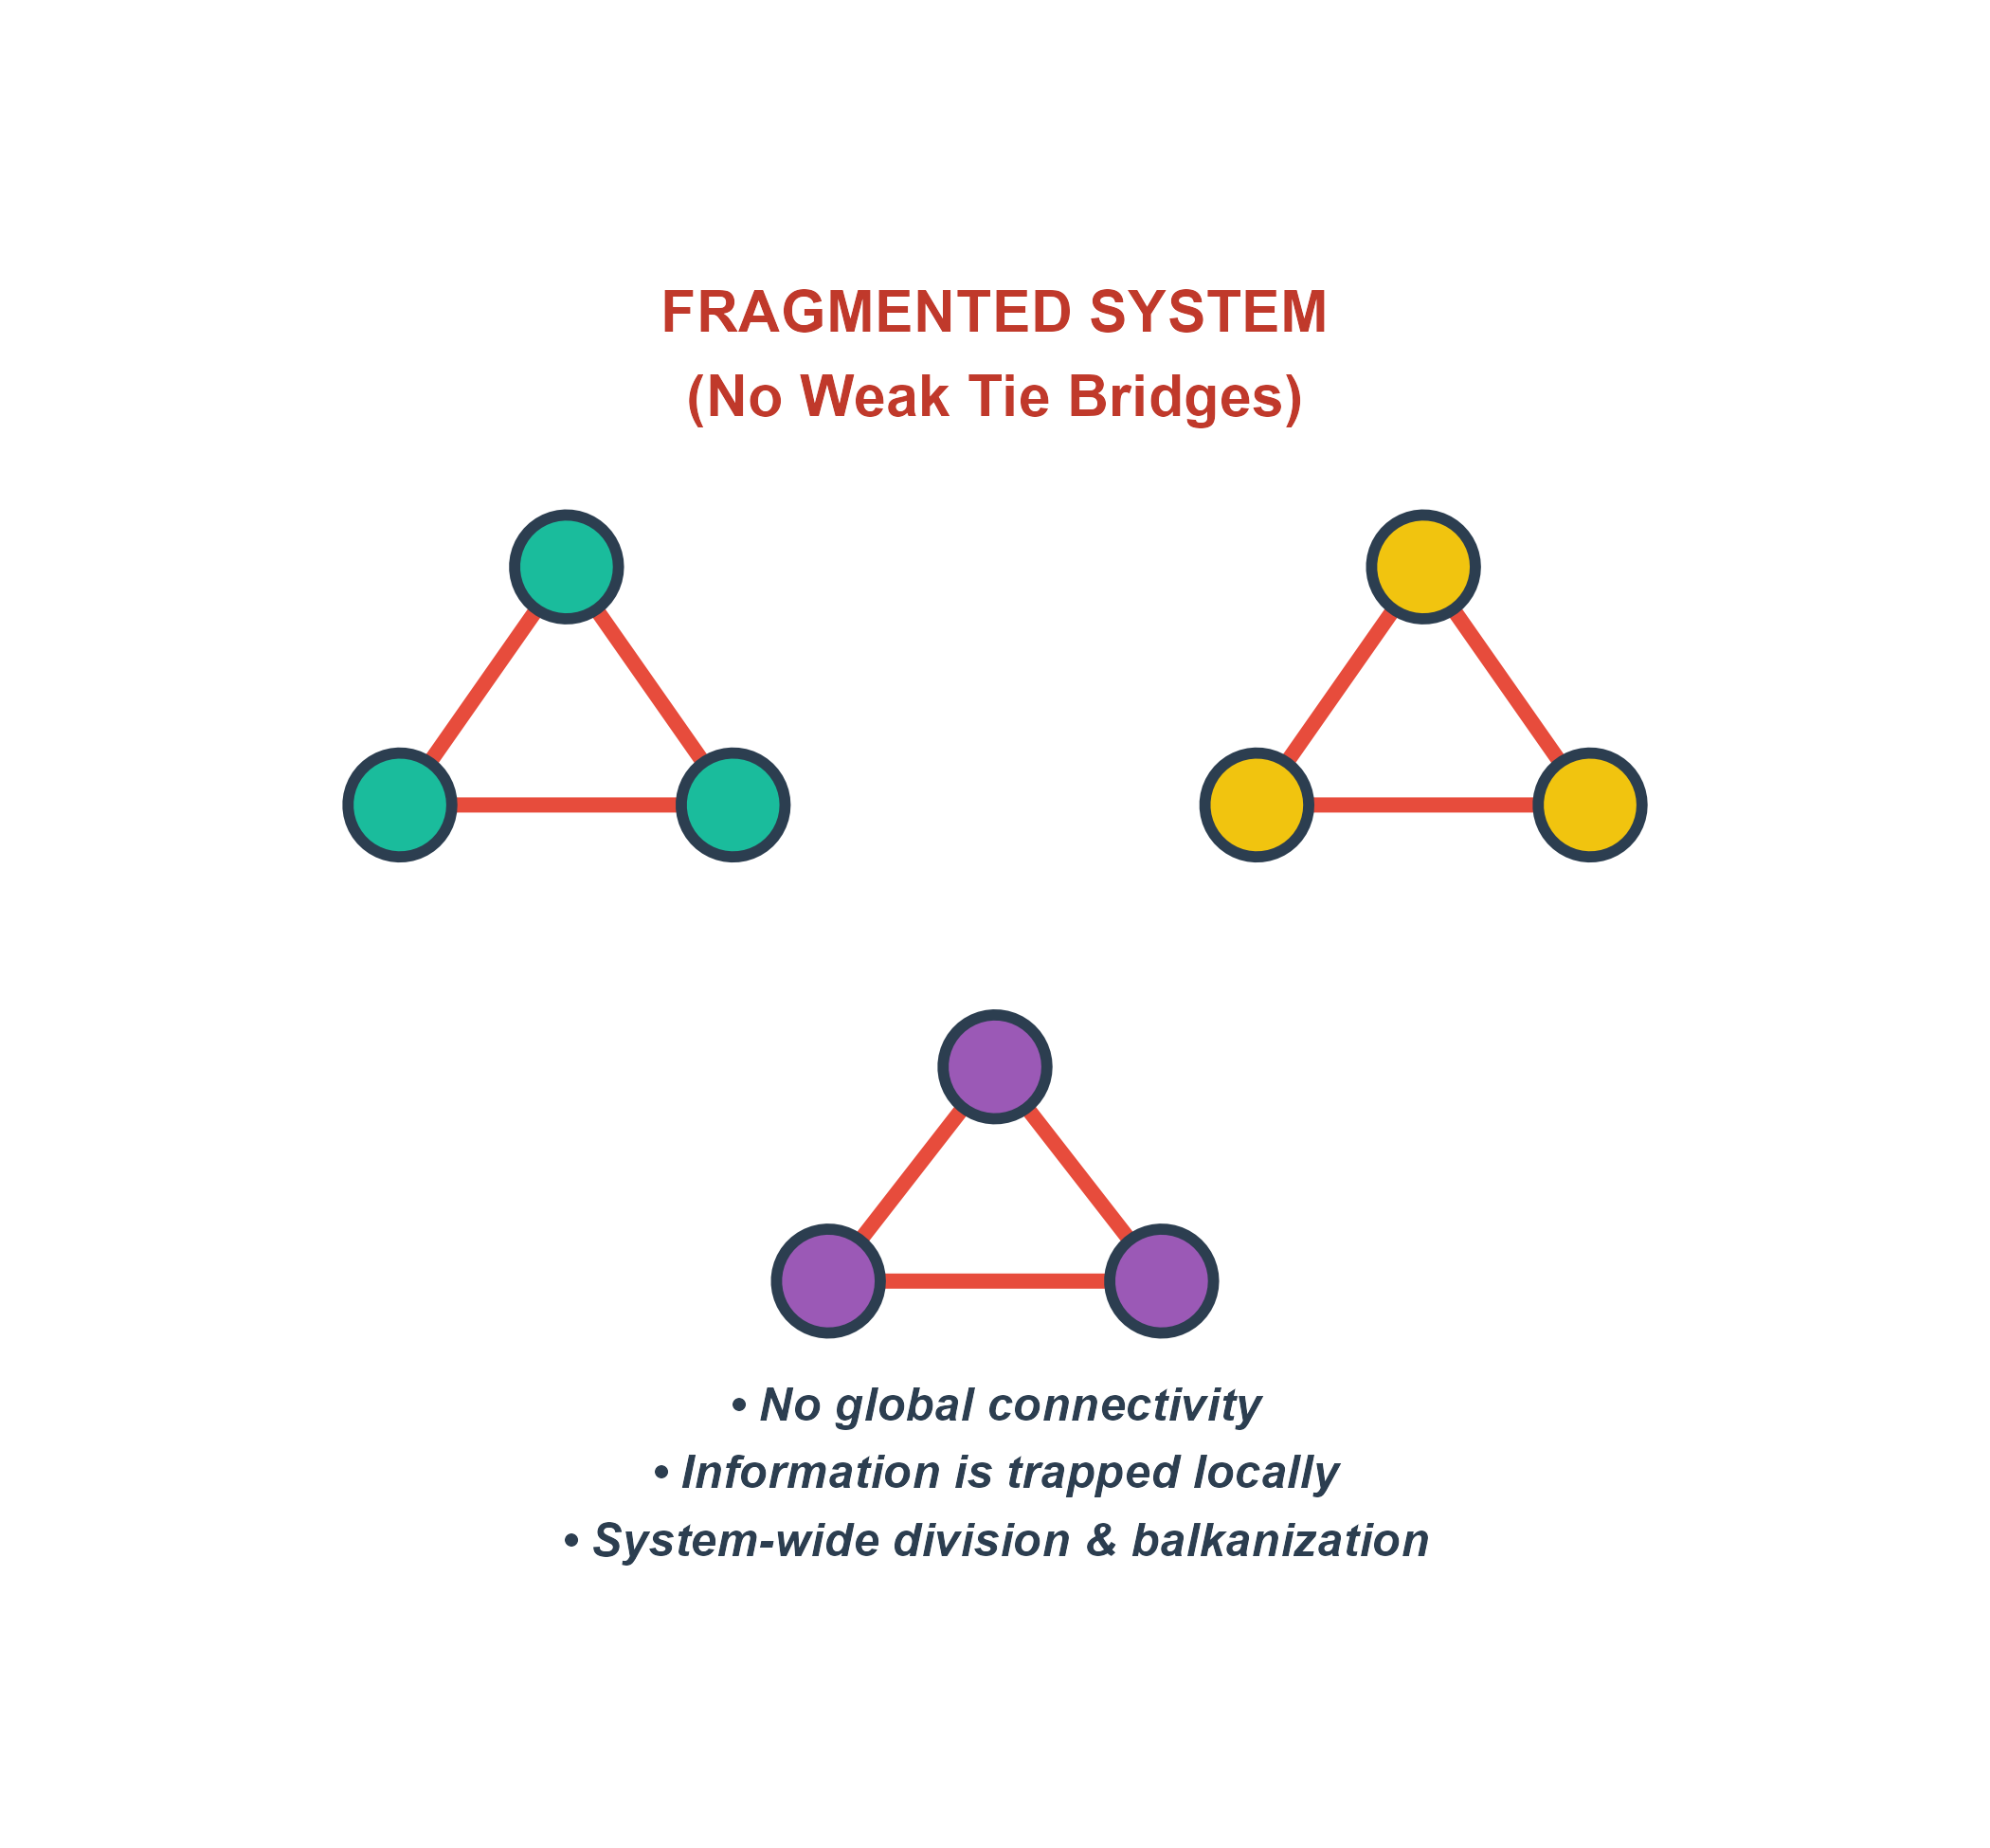
System-Level Consequences: Fragmented Networks
System-Level Consequences: Integrated Networks
Core Applications of the Theory
- 1. Finding a Job and Social Mobility
- Granovetter’s classic empirical finding (1974) showed that most people find jobs through weak ties (acquaintances), not close friends.
- Close friends have redundant information. Acquaintances belong to different circles and hear about opportunities you would never otherwise discover.
- 2. Diffusion of Innovations
- Innovations spread across social systems via weak ties.
- “Cosmopolites”—individuals with many diverse weak ties spanning different networks—act as early adopters who bring new ideas into local clusters.
Causal Testing: The LinkedIn Experiment
- The problem with past evidence: For 50 years, tests of the Strength of Weak Ties were mostly correlational and open to selection bias (e.g., highly skilled people naturally have more weak ties — so which causes which?).
- The “Dream Experiment” (Rajkumar et al., 2022, Science):
- LinkedIn randomly varied the “People You May Know” suggestions shown to about 20 million users over five years (2015–2019).
- Because the suggestions were assigned by chance — not chosen by users — differences in what happened next can be attributed to the new ties themselves.
- Researchers then tracked users’ job applications and job changes after new connections formed.
Measuring Tie Strength in Digital Networks
The LinkedIn study measured tie strength in two different ways — and got importantly different results:
1. Neighborhood Overlap (Structural Strength):
- How many friends do the two people have in common? Many mutual friends = strong tie; few mutual friends = weak tie.
- Result: Job moves were most likely through ties with a moderate number of mutual friends (around 10) — an upside-down U shape.
- Takeaway: Total strangers (0–1 mutual friends) lack the trust or motivation to help, while close friends tend to know the same people and information you do.
2. Messaging (Interaction Strength):
- How often do the two people exchange direct messages?
- Result: The ties that messaged each other the least produced the most job moves — the weakest active ties were the most useful!
The Industry Nuance: Digital vs. Traditional Sectors
A major revision to the Weak Tie theory is that its power is highly contingent on the industry’s level of digitization:
High-Tech & Digitally-Intense Sectors:
- Sectors: Software, Information Technology, Suitability for AI/Machine Learning, Remote Work, and high Robotization.
- Causal Finding: Weak ties significantly outperform strong ties.
- Why? Rapidly evolving tech environments move extremely fast. Succeeding in these sectors relies on accessing diverse, novel, and highly dispersed global information pools via low-bandwidth weak ties.
Traditional & Less-Digital Sectors:
- Sectors: Agriculture, Construction, Manufacturing, and Hospitality (low software-intensity, low automation).
- Causal Finding: Strong ties are actually more effective for job mobility than weak ties!
- Why? Traditional industries rely much more heavily on high-trust referrals, physical endorsements, offline relationships, and close, local hiring loops.
Summary of Key Takeaways
- The Structural Value of Weakness: Seemingly “weak” connections are the critical bridges that bind different parts of a social system together.
- Redundancy vs. Novelty:
- Inner Circles (Strong Ties) provide trust, emotional support, and deep, high-bandwidth knowledge transfer.
- Outer Circles (Weak Ties) provide diversity, structural reach, and access to novel opportunities.
- The Social Fabric: A healthy, resilient social network requires a balanced mixture of both strong, supportive local clusters and weak, bridging global ties.