Using Simple Correspondence Analysis to Present Tabular Data that Shows Change Over Time
**Results of the Correspondence Analysis (CA)**
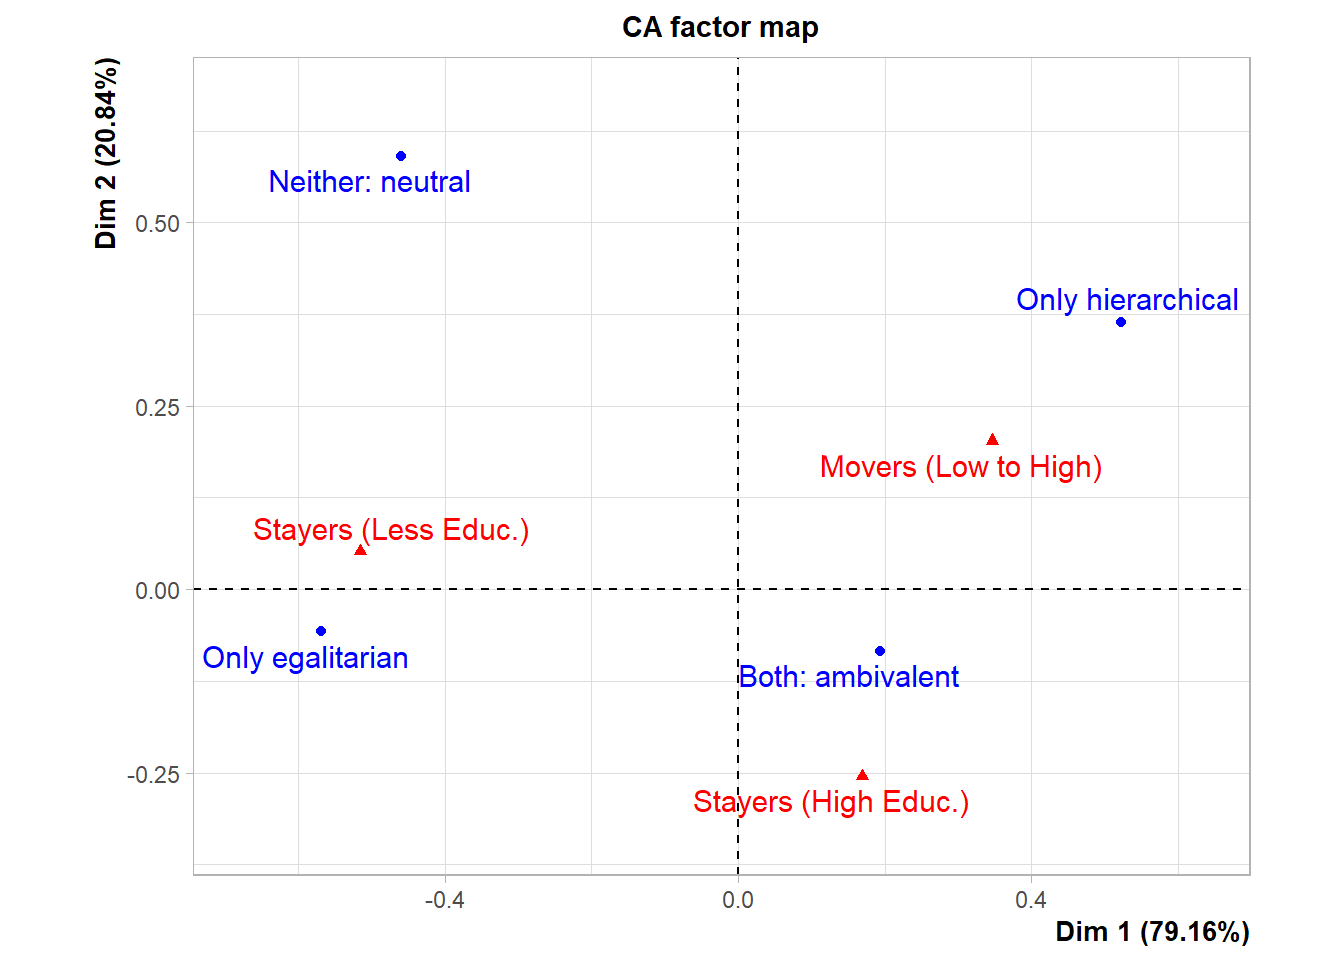
The row variable has  4  categories; the column variable has 3 categories
The chi square of independence between the two variables is equal to 15.66818 (p-value =  0.01565024 ).
*The results are available in the following objects:

   name              description
1  "$eig"            "eigenvalues"
2  "$col"            "results for the columns"
3  "$col$coord"      "coord. for the columns"
4  "$col$cos2"       "cos2 for the columns"
5  "$col$contrib"    "contributions of the columns"
6  "$row"            "results for the rows"
7  "$row$coord"      "coord. for the rows"
8  "$row$cos2"       "cos2 for the rows"
9  "$row$contrib"    "contributions of the rows"
10 "$call"           "summary called parameters"
11 "$call$marge.col" "weights of the columns"
12 "$call$marge.row" "weights of the rows"
**Results of the Correspondence Analysis (CA)**
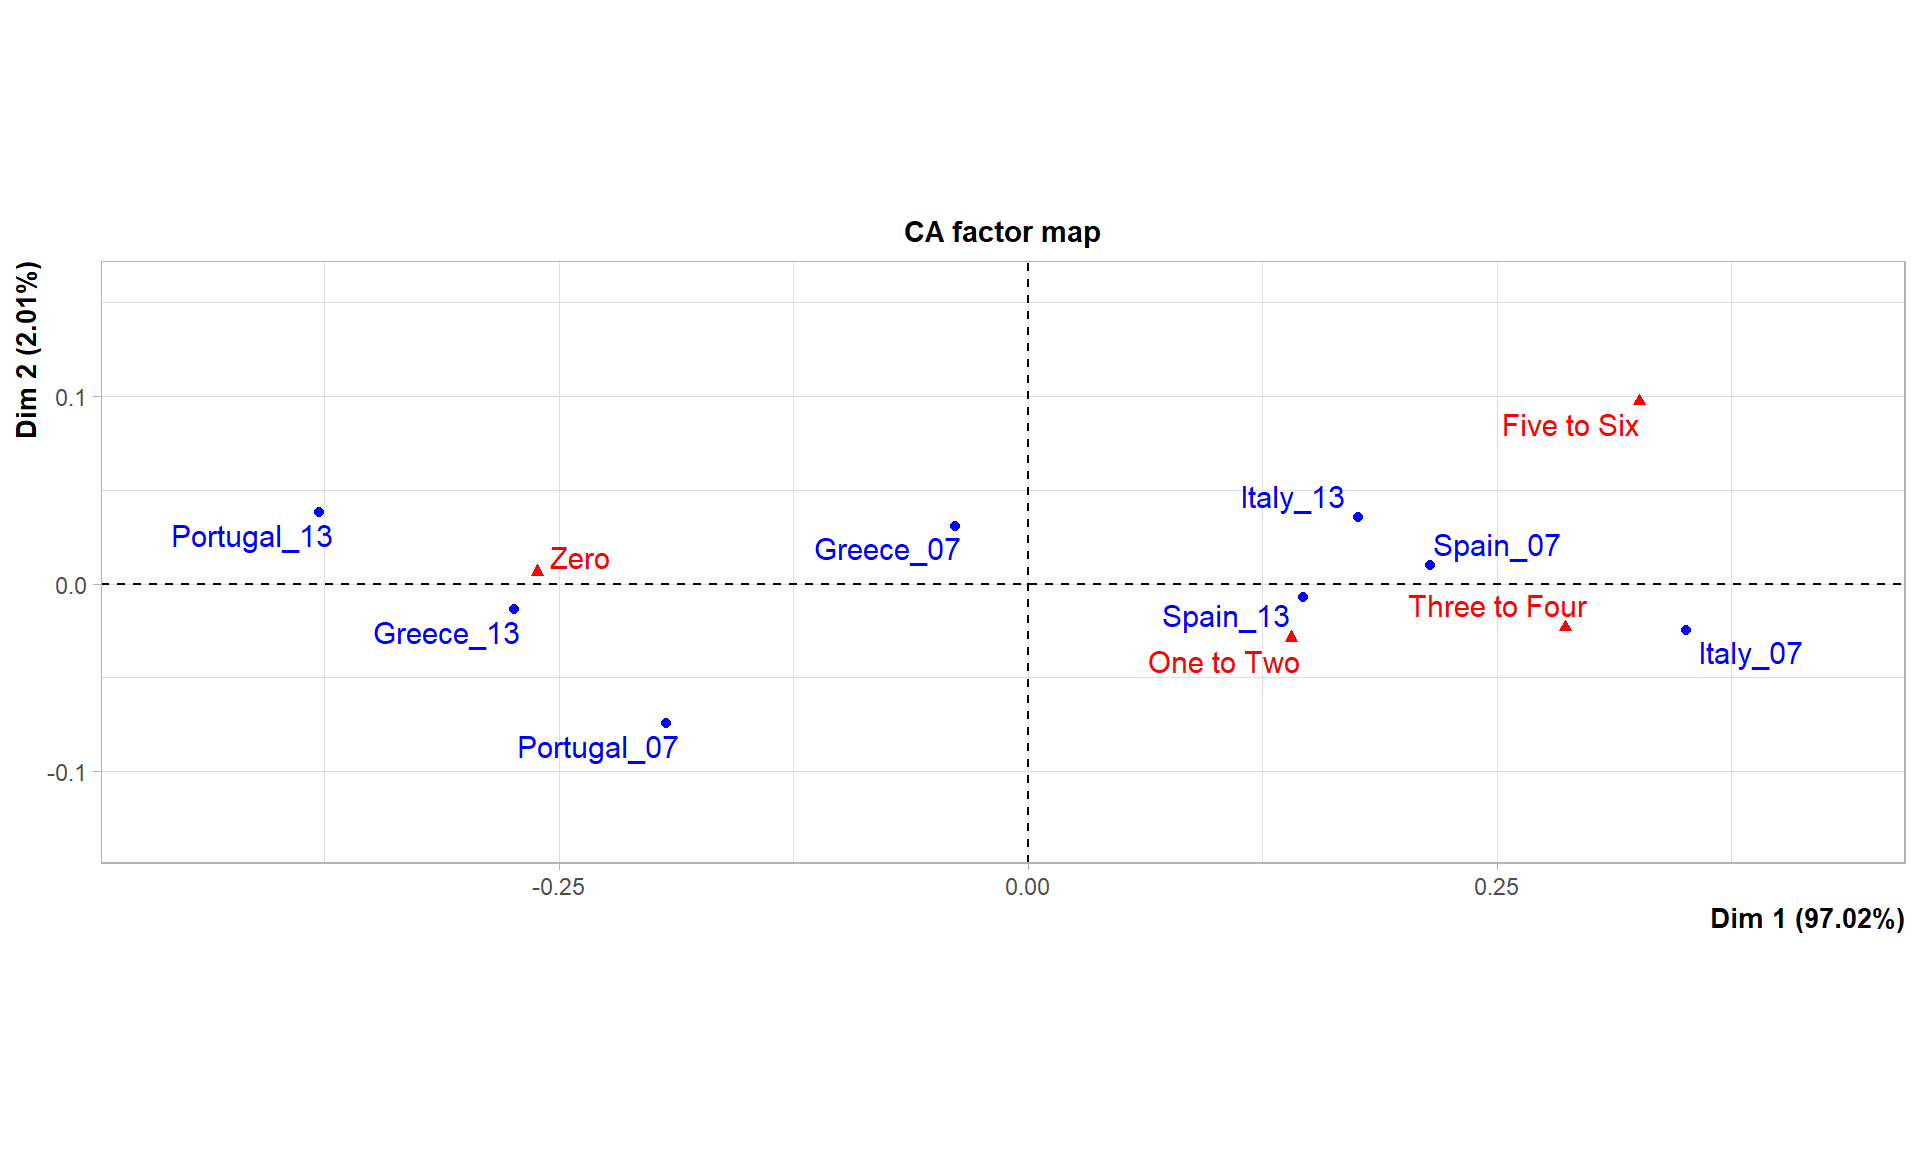
The row variable has  8  categories; the column variable has 4 categories
The chi square of independence between the two variables is equal to 436.1788 (p-value =  2.930305e-79 ).
*The results are available in the following objects:

   name              description
1  "$eig"            "eigenvalues"
2  "$col"            "results for the columns"
3  "$col$coord"      "coord. for the columns"
4  "$col$cos2"       "cos2 for the columns"
5  "$col$contrib"    "contributions of the columns"
6  "$row"            "results for the rows"
7  "$row$coord"      "coord. for the rows"
8  "$row$cos2"       "cos2 for the rows"
9  "$row$contrib"    "contributions of the rows"
10 "$call"           "summary called parameters"
11 "$call$marge.col" "weights of the columns"
12 "$call$marge.row" "weights of the rows"
Figure 1: Correspondence analysis biplot of a stacked table