43 The Diffusion of Innovations
43.1 Definition of Diffusion
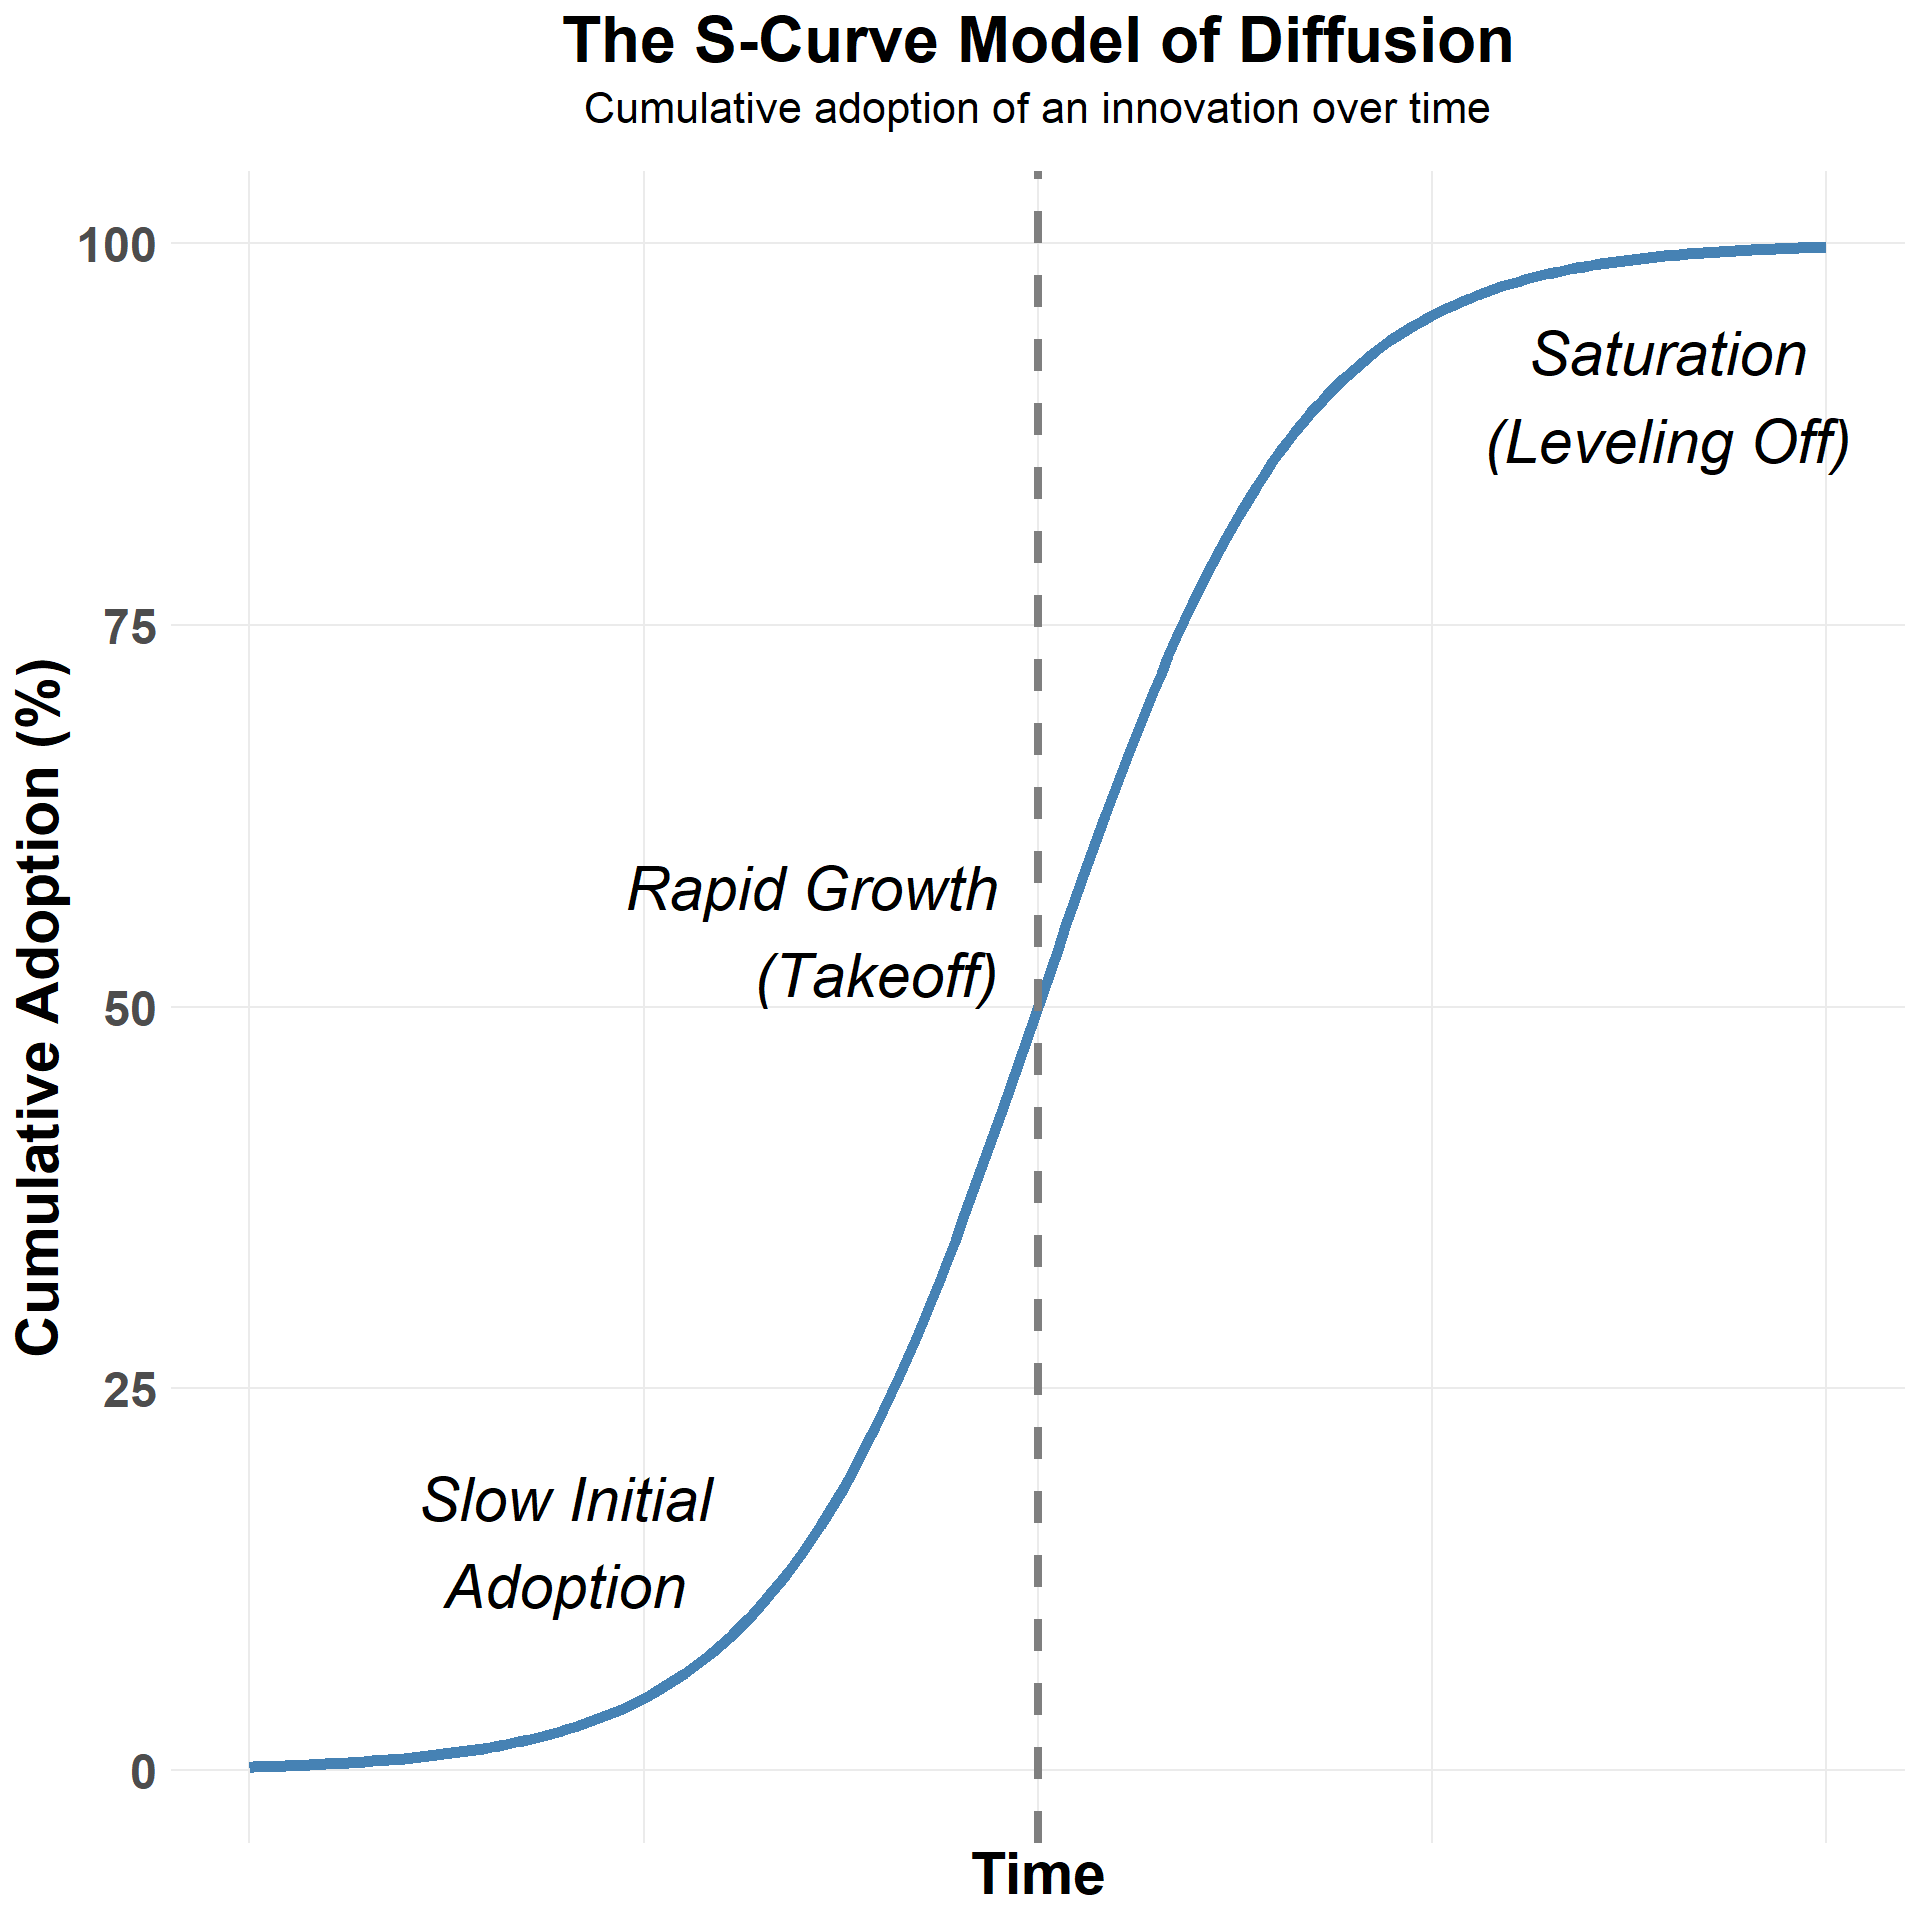
Diffusion refers to the spread of objects, ideas, information, concepts, fashions, tastes, or practices within a social network. The diffusion process typically follows an S-shaped pattern of cumulative adoptions, characterized by initial slow uptake, rapid spread, and a final slow saturation phase.
43.2 Components of Diffusion
The diffusion process has five key components:
- Innovation: This is the object that diffuses.
- Actors: These are typically individuals, but can also be groups, that either adopt or fail to adopt the innovation.
- Flow: This describes the movement of the innovation from a source actor to an adopting actor.
- Mechanism: This refers to the process that links sources and adopters. Examples of mechanisms include imitation, physical contact, proximity, influence, and comparison.
- Outcome: This is the end state of the adopting actor after the diffusion process, which can include opinion change, conversion, participation, or infection.
43.3 The S-Curve Model
The S-curve model of diffusion is a widely recognized pattern illustrating how new objects, ideas, information, or practices spread within a social network over time. It depicts cumulative adoptions following a distinctive S-shape.
The S-curve is characterized by three main phases:
- Initial Slow Uptake: At the beginning, the rate of adoption is slow, representing a period where only a small segment of the population embraces the innovation.
- Rapid Spread: Following the initial slow phase, there is a period of rapid adoption where the innovation quickly gains traction and spreads throughout the population. The number of new adopters per unit of time peaks during this “take off” period, indicating accelerated diffusion.
- Final Slow Saturation: As the innovation approaches widespread adoption, the rate of new adoptions decelerates, eventually reaching a saturation point where most of the potential adopters have integrated the innovation.
43.3.1 The Tipping Point
The “tipping point” for an innovation, the critical juncture where it shifts from slow growth to rapid adoption, typically occurs after the early adopters and before the early majority fully engage. Innovations that fail to reach this tipping point often die out.
Historically, many innovations have followed this S-shaped pattern. Examples include the spread of Hybrid Seed Corn in two Iowa communities from the late 1920s to the mid-1940s. More broadly, the S-curve is observed in the adoption of various household technologies over time, such as electricity, telephones, automobiles, radio, color TV, air conditioning, computers, cellphones, VCRs, and the internet. Social movements and protests (such as the BLM protests of 2020 and 2021) also exhibit S-curve diffusion, with an initial long uptake period followed by rapid mobilization leading to rapid spread, and then saturation as the protest cycle winds down.
43.4 Global Threshold Models
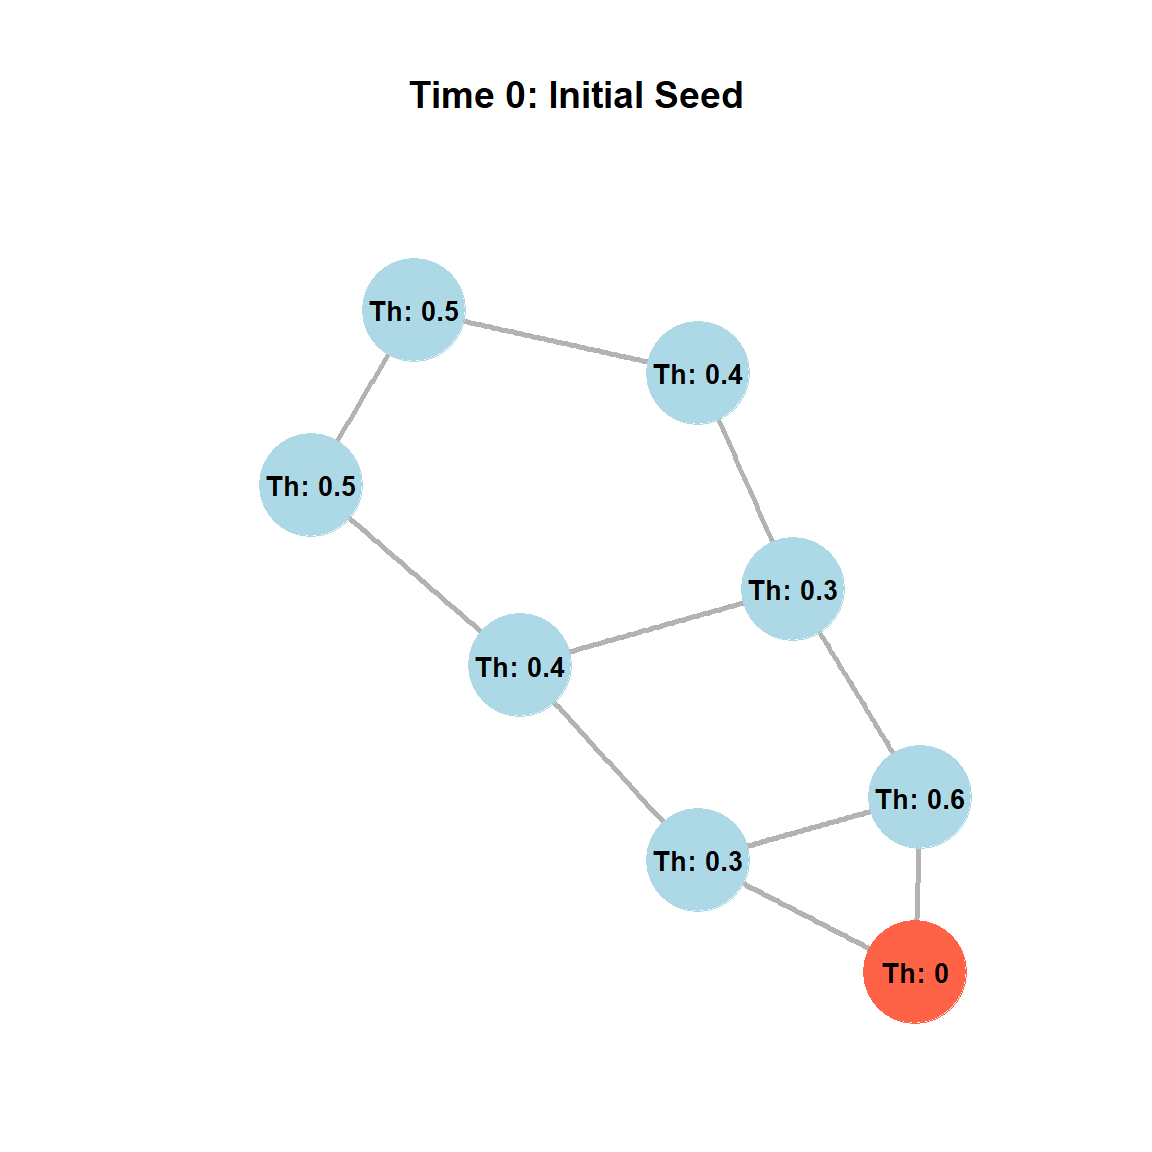
The Global Threshold Model, proposed by Granovetter and Soong in 1978, posits that each individual in a social system has a “threshold” for adopting an innovation or behavior. This threshold, denoted as \(q(i)\) for an individual \(i\), represents the proportion of other people in the population who must have already adopted the innovation before individual i will adopt it. The value of \(q(i)\) for any individual is between zero and one (\(0 < q(i) < 1\)).
An individual \(i\) will adopt when the observed proportion of people (\(p\)) who have already adopted in the overall population reaches or exceeds their personal threshold q(i) (i.e., \(p = q(i)\)).
A key assumption of this model is that individuals have access to and are aware of the actual proportion of adopters across the entire population (they have global information about the diffusion process), which may not always be realistic for all scenarios. This model is particularly appropriate for the diffusion of behaviors that are public and easily observable.
43.4.1 Explaining the S-Shaped Diffusion Curve
The Global Threshold Model can effectively explain the typical S-shaped pattern of cumulative adoptions observed in diffusion processes. This S-curve is characterized by:
- Initial slow uptake: This occurs because only a few individuals with very low \(q\) values (low thresholds) adopt early on.
- Rapid spread: As more people adopt, the proportion of adopters (\(p\)) increases, reaching the thresholds of individuals with middle \(q\) values. Since many people tend to have moderate thresholds (forming a “bell curve” distribution of \(q\) values), this leads to a rapid increase in adoption rates.
- Final slow saturation: Eventually, only individuals with high \(q\) values (high thresholds) remain. As the adoption rate slows, it takes longer for the overall proportion of adopters to reach these high thresholds, leading to a flattening of the S-curve as saturation is approached.
The shape of the distribution of these individual thresholds (\(q\) values) within a population is critical in determining whether an innovation achieves widespread diffusion. If the distribution of q values is skewed towards “risk-averse late adopters” (i.e., many people have high thresholds), full diffusion is less likely to occur. Conversely, if the distribution is skewed towards “high-risk early adopters” (i.e., many people have low thresholds), diffusion is more likely to be successful.
The dynamics of protest recruitment often follow an S-shaped diffusion curve, which can be understood through the Global Threshold Model. For instance, a study on protest recruitment shows an initial long uptake period with a low proportion of adopters. Then, a “big mobilization” event occurs, which helps to recruit individuals with higher thresholds, leading to a rapid spread of participation. This implies that the initial slow uptake consists of individuals with low q values, while the rapid spread involves individuals whose thresholds are met by the increasing visible participation in the protest movement.
43.5 Rogers’ and Valente’s Classification of Adopters
Roger’s and Valente’s classifications provide different but complementary frameworks for understanding how individuals adopt innovations within a social system.
43.5.1 Roger’s Classification of Adopters
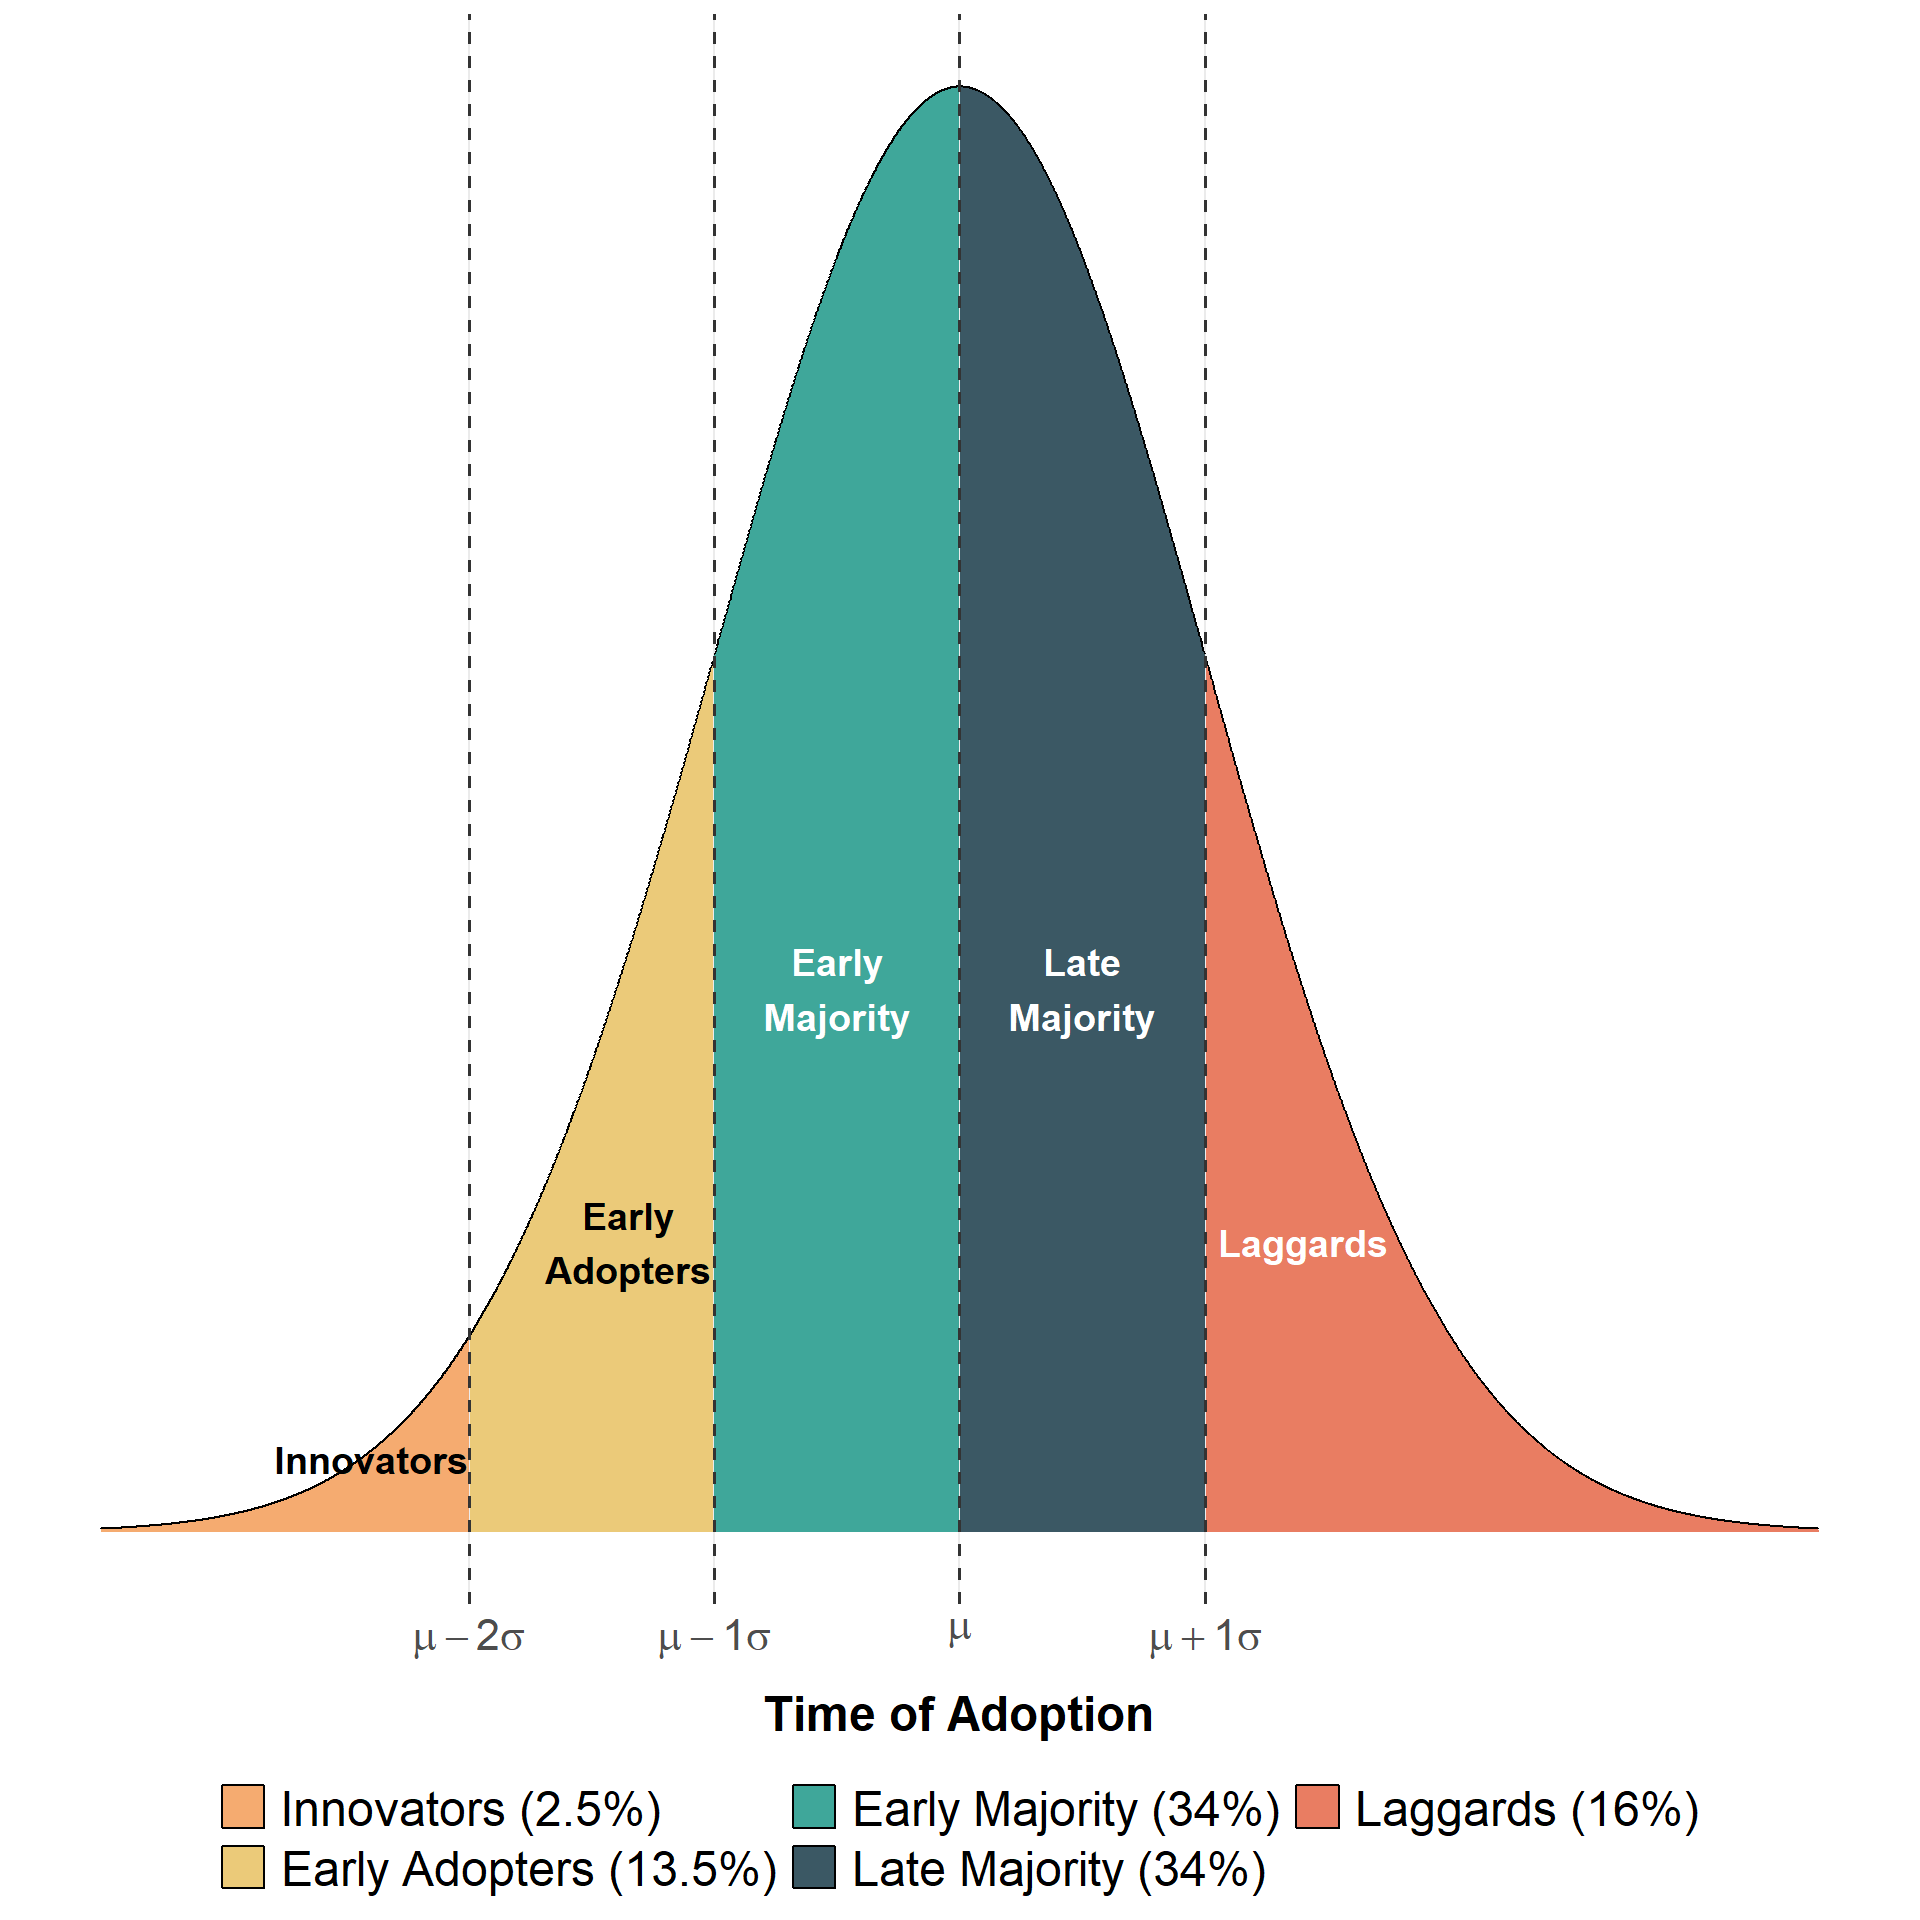
Everett Rogers’ classification categorizes individuals into five groups based on their innovativeness and the timing of their adoption of a new idea or product. This model aligns with the S-shaped diffusion curve of cumulative adoptions over time. The categories are defined by their time-of-adoption relative to the average and represent distinct segments of the population:
- Innovators (2.5%): These individuals are venturesome and are the very first to adopt an innovation. Their time-of-adoption is greater than one standard deviation earlier than the average adoption time.
- Early Adopters (13.5%): Considered opinion leaders, they adopt the innovation after the innovators. They play a crucial role in influencing the early majority. Like innovators, their time-of-adoption is also more than one standard deviation earlier than the average.
- Early Majority (34%): These individuals adopt the innovation just before the average member of the social system. Their time-of-adoption is bounded by one standard deviation earlier than the average.
- Late Majority (34%): This group adopts the innovation after the average member of the system. They tend to be more skeptical and cautious about new ideas. Their time-of-adoption is bounded by one standard deviation later than the average.
- Laggards (16%): As the last to adopt, laggards are often traditional, risk-averse, and may be isolated within the social system. Their adoption occurs later than one standard deviation from the average.
Roger’s classification relates to the idea of the tipping point (sometimes referred to as “the chasm” in commercial contexts), which happens around the time after the early adopters have adopted but before the full engagement of the early majority. Innovations that fail to reach this tipping point often do not achieve widespread diffusion and die out.
43.5.2 Valente’s Classification of Adopters (Network Threshold Model)
Thomas Valente’s Network Threshold Model revisits and refines Roger’s classification by incorporating the idea of individual thresholds for adoption within a network context. This model acknowledges that individuals adopt an innovation when the proportion of their direct contacts who have already adopted reaches a certain personal threshold.
Unlike Granovetter’s global threshold model, which assumes individuals know the proportion of adopters in the whole population, Valente’s network threshold model is more realistic as it is based on an individual’s local network information.
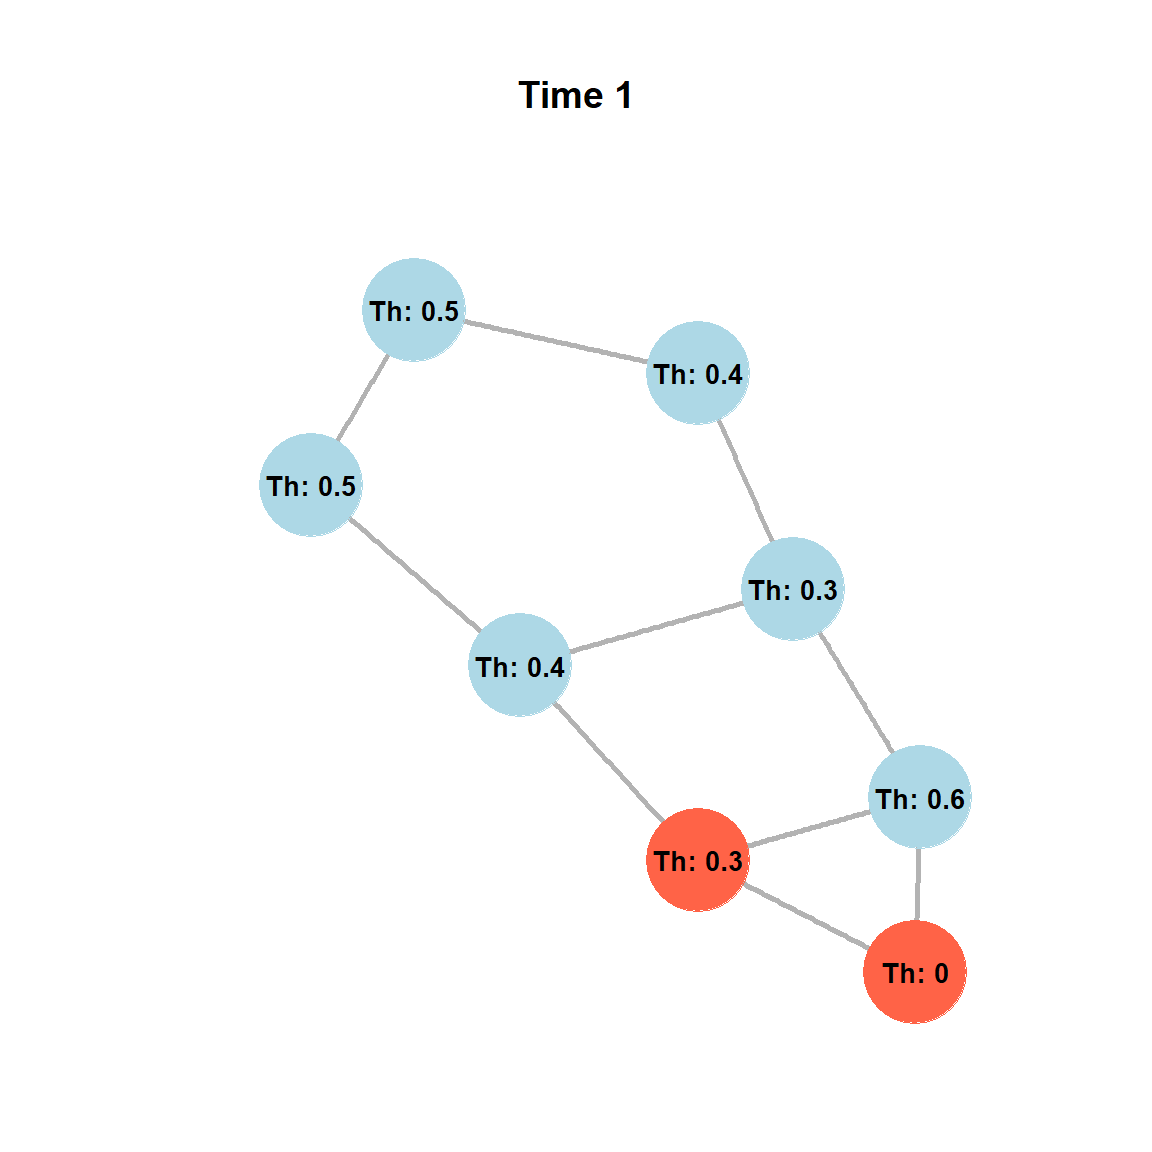
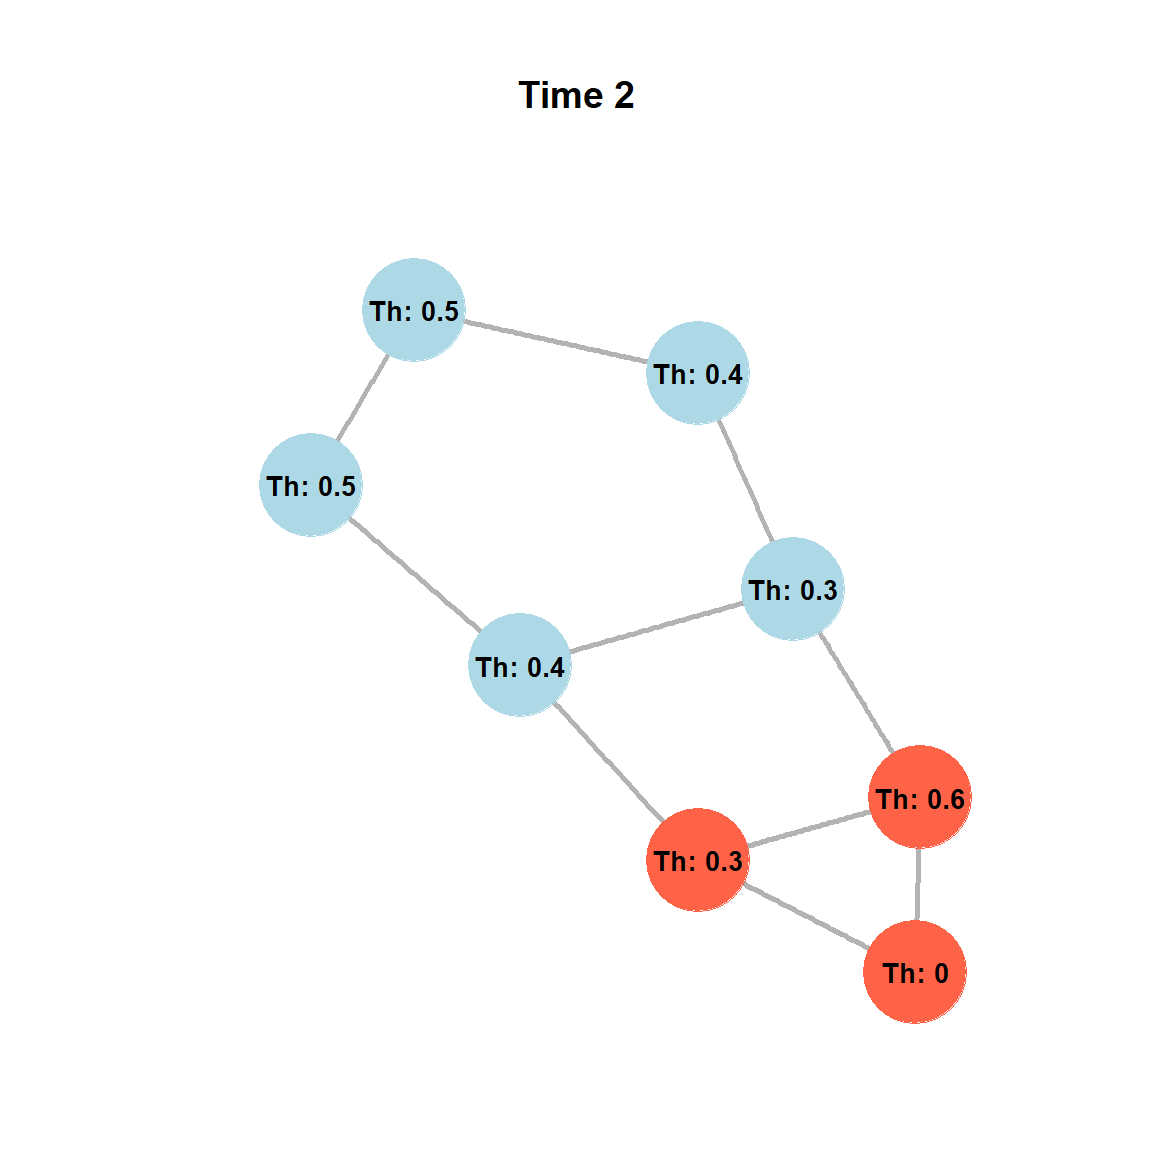
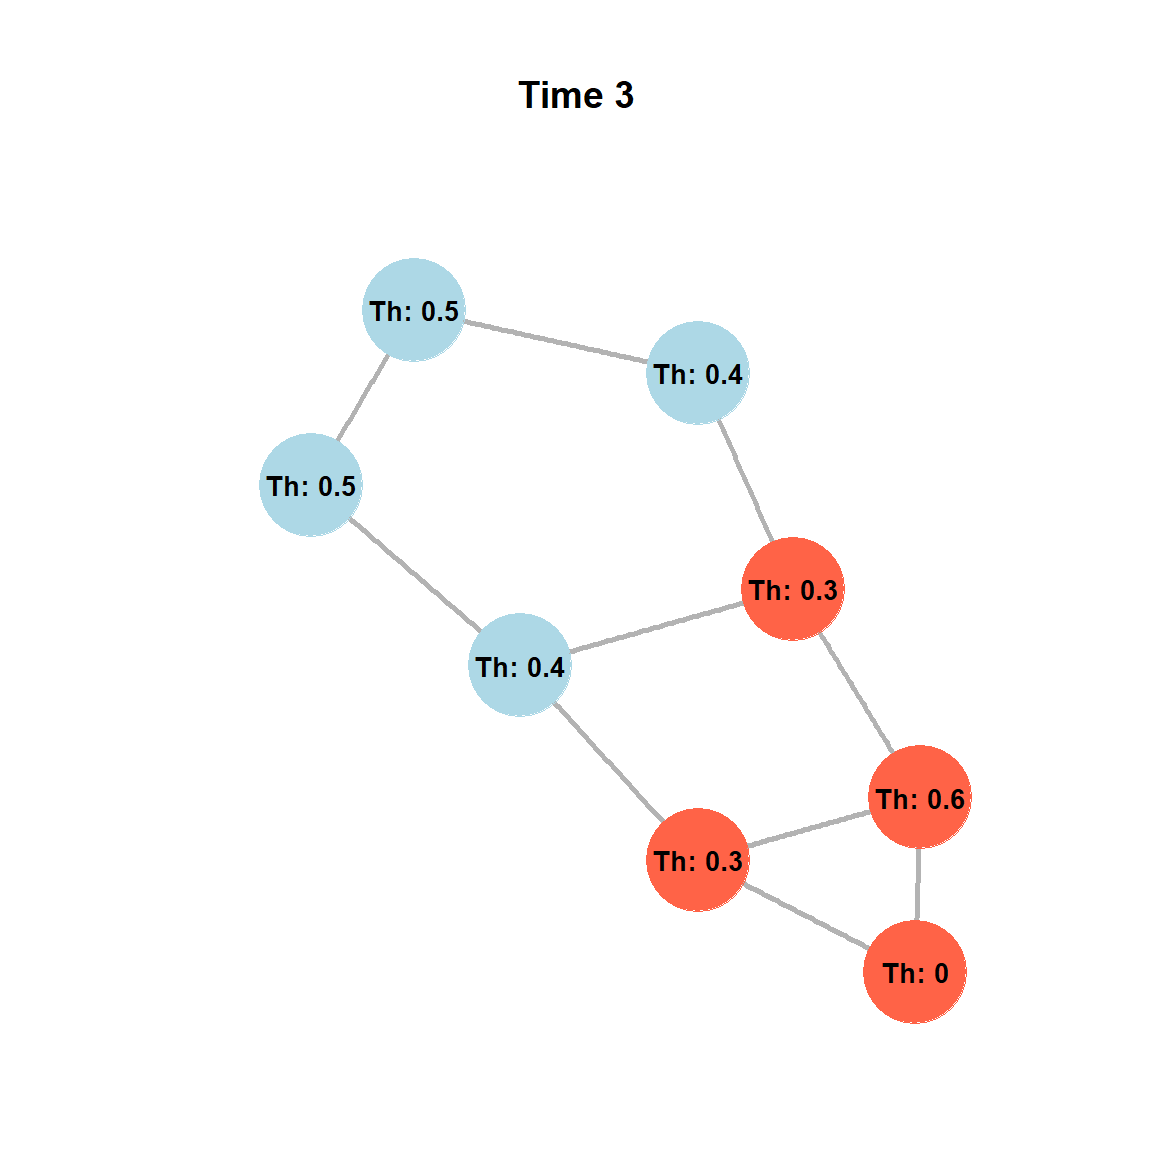
In Valente’s Network Threshold Model, each person (\(i\)) has an exposure level, \(e(i)\), which is defined as the proportion of their friends who have adopted the innovation. A person (ego) adopts the innovation when this proportion of adopted friends (\(e(i)\)) equals or exceeds their personal threshold (\(q(i)\)).
Let’s illustrate with an example: Imagine Person 1 has a threshold (\(q\)) of \(0.25\). This means Person 1 needs at least 25% of their friends to adopt before they adopt. This person has an ego-network size of three.
- Time 1: If none of Person 1’s friends have adopted (0% adoption among friends), Person 1 does not adopt.
- Time 2: If one friend adopts, and this constitutes, for example, 33% of their friends, then 33% (0.33) is greater than or equal to their 0.25 threshold. Thus, Person 1 adopts.
Now consider Person 2 with a higher threshold (\(q\)) of \(0.75\). This means Person 2 needs at least 75% of their friends to adopt before they adopt. This person has four alters in their ego-network.
- Time 1 & 2: Even if one or two friends adopt (e.g., 25% or 50% of friends), this proportion is below Person 2’s 0.75 threshold, so they do not adopt.
- Time 3: If three friends adopt, and this constitutes 75% of their friends, then 75% (0.75) is equal to their 0.75 threshold. Thus, Person 2 adopts.

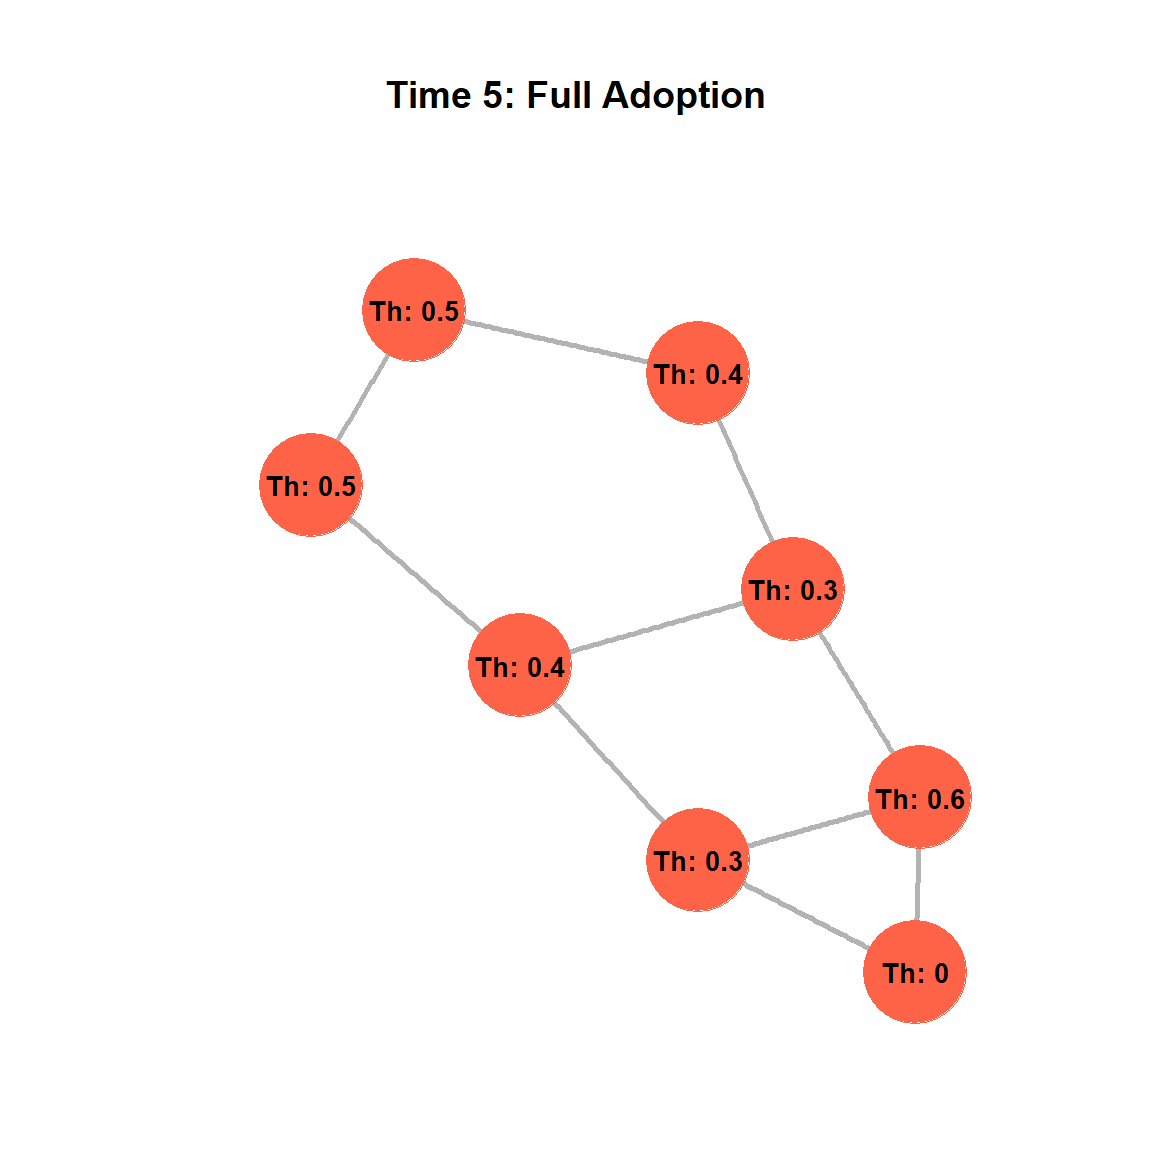
Valente’s model categorizes adopters based on two dimensions of their threshold: their Whole Network Threshold (their general receptiveness to adoption across the entire system) and their Personal Network Threshold (how many of their direct contacts need to adopt before they do). This creates a two bytwo2 matrix, yielding four types of adopters:
- True Innovators (Influentials): These individuals have a Low Personal Network Threshold and a Low Whole Network Threshold. They are among the first to adopt because they require little external validation from their direct contacts or the broader system. These are the individuals often identified as “opinion leaders” who influence the attitudes, beliefs, motivations, and behaviors of others. They are typically visible, occupy powerful positions (e.g., celebrities, politicians), and are well-connected in terms of degree, eigenvector, and betweenness centrality.
- Isolates: These individuals have a Low Personal Network Threshold but a High Whole Network Threshold. Despite being susceptible to their immediate contacts, they may be isolated from the broader network, limiting their exposure to the innovation until it reaches a very high saturation point system-wide.
- Connected Bandwagon: This group has a High Personal Network Threshold but a Low Whole Network Threshold. They require a significant proportion of their direct contacts to adopt before they do, but they are generally open to the innovation when it becomes prevalent in their immediate social circle. They are likely to join a trend once it has gained momentum within their connections.
- Resistant Rearguard: These individuals are characterized by both a High Personal Network Threshold and a High Whole Network Threshold. They are the most resistant to adopting, requiring strong and widespread adoption among their direct contacts and the system as a whole before they consider the innovation. This group largely corresponds to the “laggards” in Roger’s classification.
Valente’s model also provides insights into the Local/Cosmopolitan split in diffusion. Cosmopolitan innovators, who tend to be early adopters relative to the system and have very low thresholds relative to their network, often adopt from media or weak ties. In contrast, late adopters often rely on strong ties or friends for their adoption decisions. The network threshold model is particularly relevant for modelling diffusion that happens via complex contagion, which involves innovations entailing risk, social ostracism, or potential resource loss, as these require higher thresholds and often exposure to multiple sources or strong ties for individuals to adopt.
43.6 Simplex versus Complex Contagion
Simplex and complex contagion represent two distinct mechanisms by which objects, ideas, information, fashions, tastes, or practices spread through a social network (Centola and Macy 2007). The primary difference lies in the threshold for adoption and the nature of social reinforcement required for an individual to adopt an innovation.
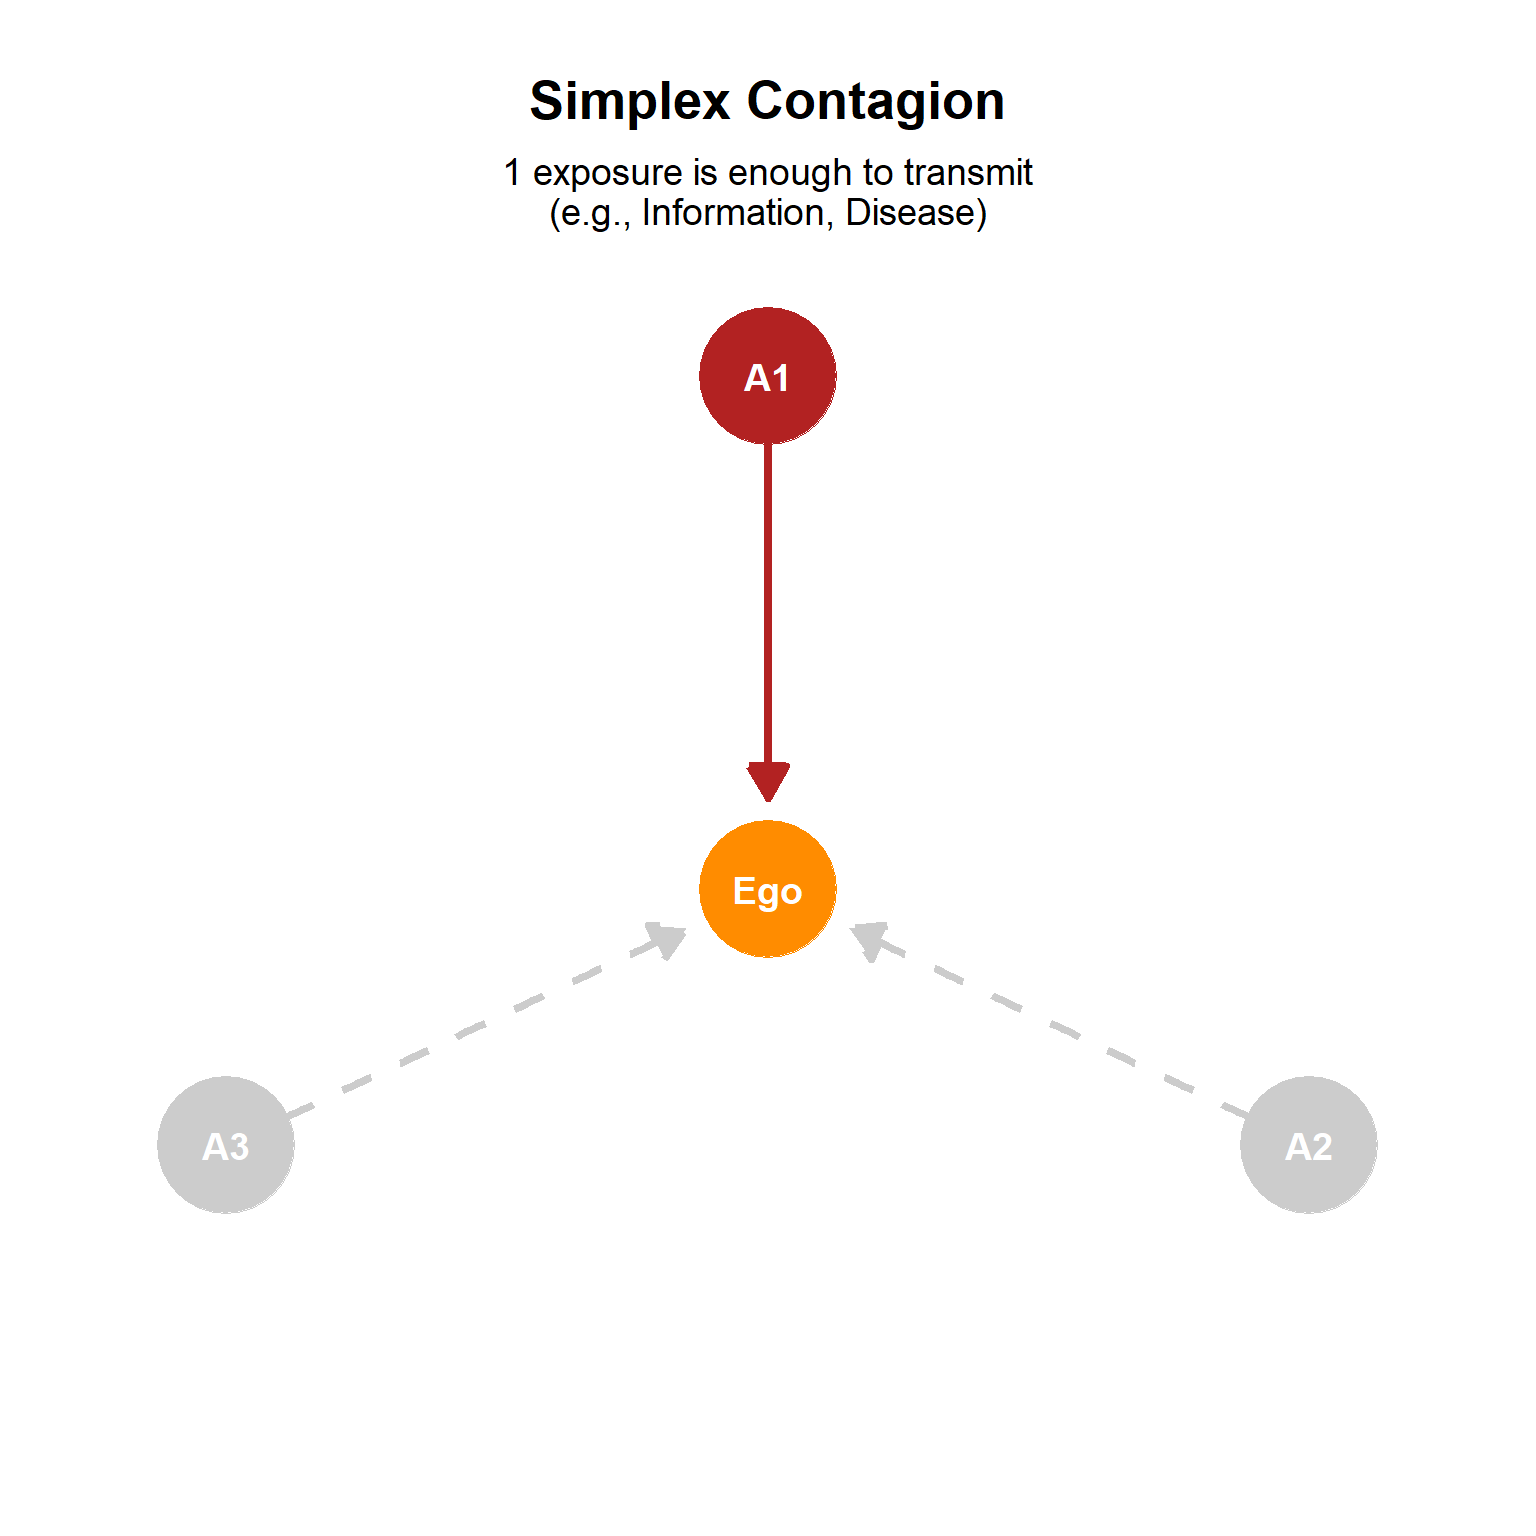
43.6.1 Simplex Contagion
Simplex contagion refers to the diffusion of innovations or behaviors that require only a single exposure or a low threshold for adoption. These are typically items or information that carry low risk or cost, and a single instance of exposure is sufficient for an individual to adopt or transmit it.
Characteristics of simplex contagion:
- Low Threshold: Individuals have a low internal barrier to adoption, meaning they don’t need much persuasion or multiple endorsements.
- Single Source Sufficient: Exposure to just one adopter is often enough to trigger adoption.
- Nature of Information: Often involves “simple” information that is easy to understand and act upon without significant implications.
Examples:
- Information: Simple facts, news, or gossip can spread as simplex contagion. For example, learning “Who’s hiring?” or “What’s the best messaging app?” typically only requires one reliable source.
- Disease: Biological contagions like a disease can spread from a single point of contact.
Role of Ties:
Simplex contagion spreads efficiently through weak ties. Weak ties are valuable because they act as “bridges” to diverse and otherwise disconnected parts of the social structure, providing access to novel information that might not be available within one’s immediate strong-tie network. While strong ties involve frequent interaction, weak ties offer a broader reach and access to non-redundant information.
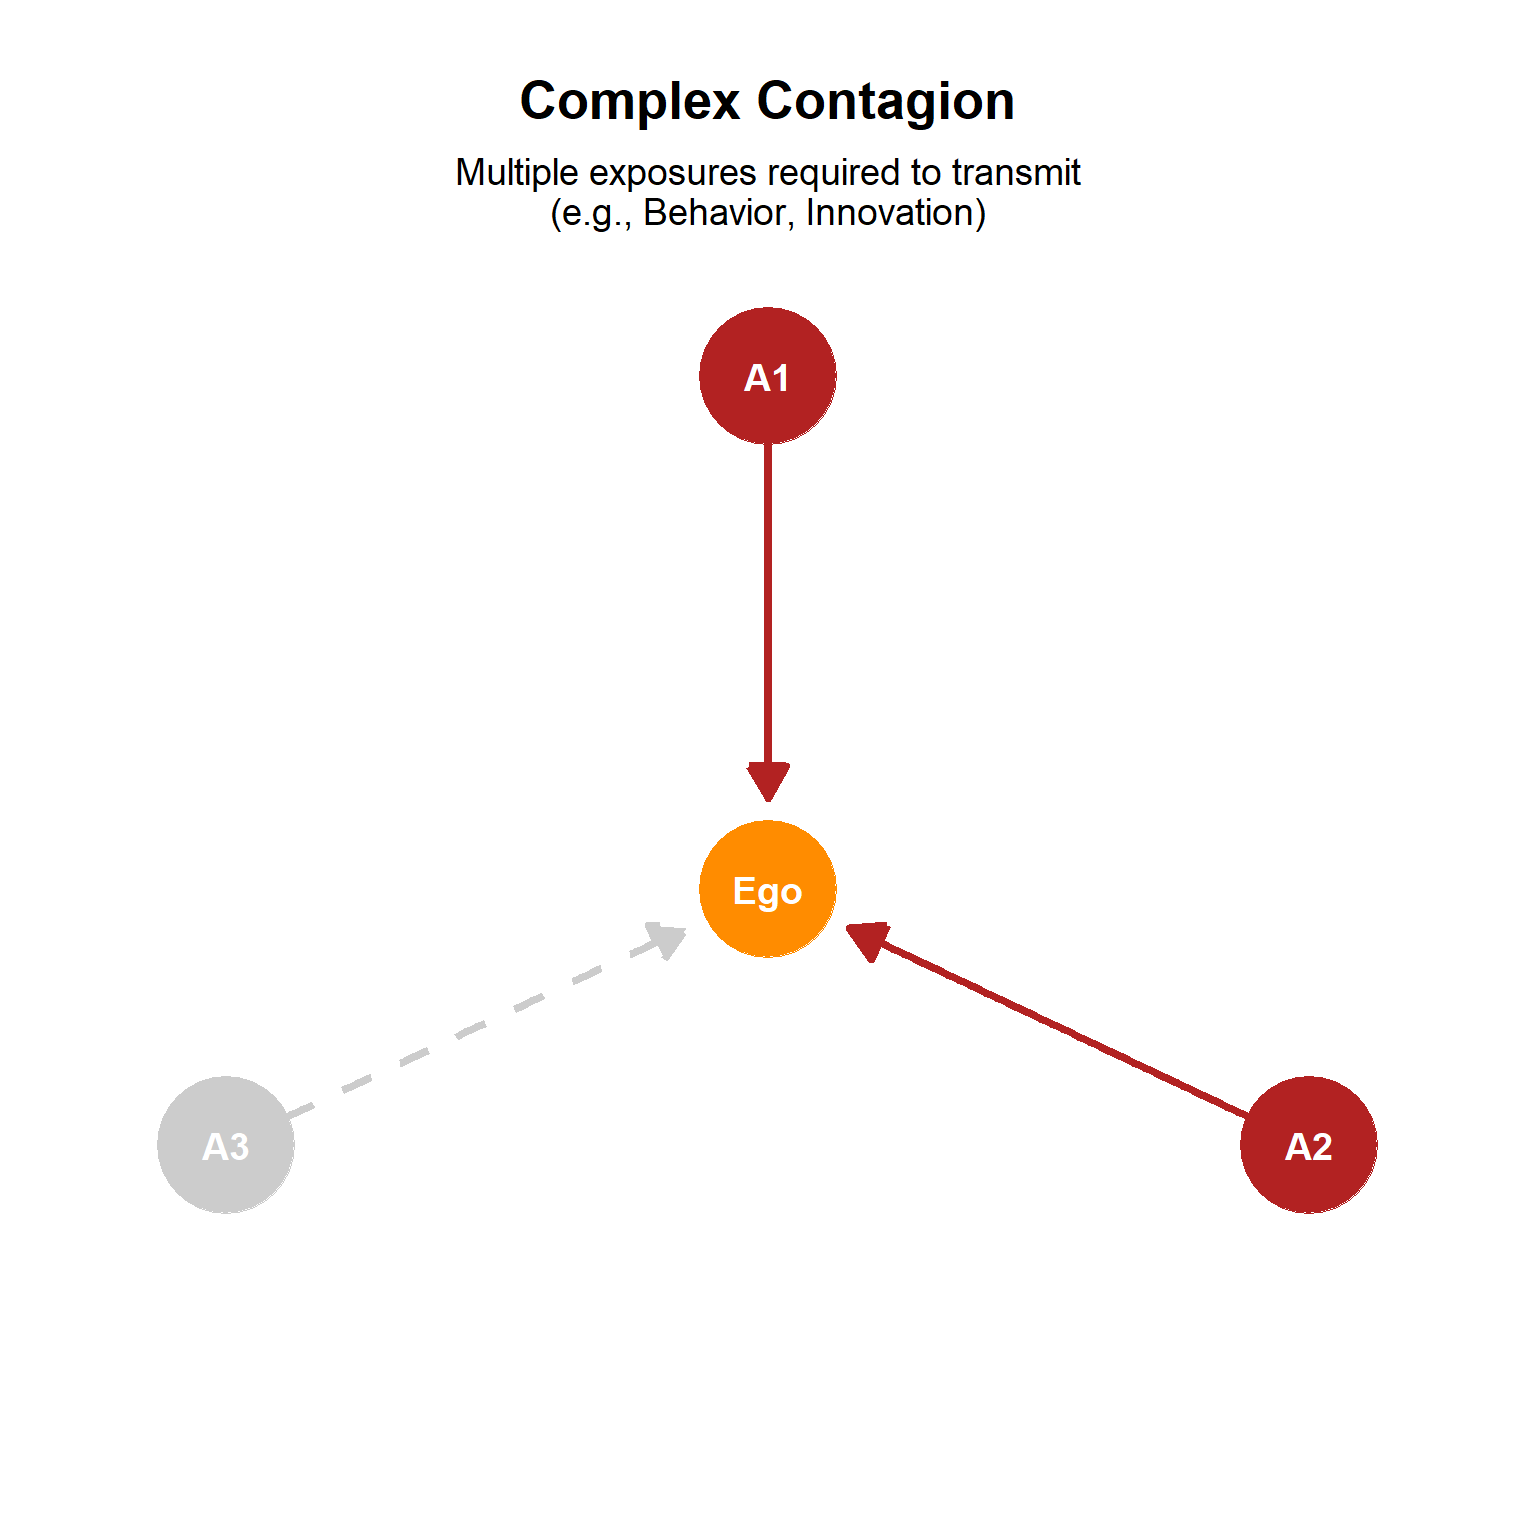
43.6.2 Complex Contagion
Complex contagion, in contrast, involves the diffusion of innovations or behaviors that entail higher thresholds for adoption, often requiring exposure to multiple sources or repeated reinforcement. These innovations typically involve some form of risk, social ostracism, or potential loss of resources, making individuals more cautious about adopting.
Characteristics:
- High Thresholds: Individuals have a higher internal barrier to adoption due to perceived risks or costs.
- Multiple Sources Required: Adoption often necessitates seeing multiple friends or contacts adopt, or receiving reinforcement from several sources. This provides validation, reduces perceived risk, and signals legitimacy.
- Nature of Information: Often involves complex, interdependent information that requires greater trust and intimacy for effective transmission and adoption.
Examples:
- High-risk Social Movement Participation: Joining a protest or a high-stakes social movement often requires multiple trusted contacts to participate, as there are personal risks involved.
- Religious Conversion: A profound personal change like religious conversion is rarely influenced by a single casual encounter; it usually requires consistent reinforcement from multiple individuals within one’s social circle.
- Migration: The decision to migrate is a significant one with many uncertainties, often requiring validation and support from multiple social ties.
- Adopting Complex Knowledge: Learning how to do complex tasks, like network analysis in a programming language (e.g., R), is better transmitted through higher bandwidth ties which provide the necessary trust and depth of interaction for complex, interdependent information transfer.
Complex contagion typically spreads more effectively through strong ties and within cliques (densely connected subgroups). While weak ties are good for novel information, they are less effective for complex contagion because they often connect infrequently and may not provide the sustained or multiple exposures necessary for adoption when the stakes are high. Strong ties provide the redundancy, trust, and frequent interaction needed to overcome the higher thresholds associated with complex behaviors.
| Feature | Simplex Contagion | Complex Contagion |
|---|---|---|
| Threshold | Low; single exposure often sufficient | High; requires exposure to multiple sources |
| Risk/Cost | Low risk/cost | High risk, social ostracism, resource loss |
| Primary Ties | Weak ties (bridges) | Strong ties (cliques) |
| Information Type | Simple, novel information | Complex, interdependent information |
| Diffusion Speed | Can spread faster via weak ties | Can spread faster via cliques and strong ties |
Table Table 43.1 summarizes the key features of the simplex versus complex contagion processes.
The concepts of simplex and complex contagion are closely related to threshold models of diffusion. Granovetter’s Global Threshold Model assumes individuals know the proportion of adopters in the whole population, which might be less realistic for complex contagions. Valente’s Network Threshold Model, on the other hand, is more appropriate for complex contagion as it posits that individuals adopt when a certain proportion of their direct contacts have adopted, reflecting the need for local validation and multiple exposures inherent in complex contagion.
44 References
Centola, Damon, and Michael Macy. 2007. “Complex Contagions and the Weakness of Long Ties.” American Journal of Sociology 113 (3): 702–34.