---
title: "Community Structure"
---
## What are communities?
What are communities? In networks, communities are subsets of nodes that have more interactions or connectivity within themselves than outside of themselves (these are sometimes called "modules" outside sociology). Communities thus exemplify the sociological concept of a **group**.
A network has *community structure* if it contains many such subsets or groups of nodes that interact preferentially with one another. Not all networks have to have community structure; a network in which all nodes interact with equal propensity doesn't have communities.
So whether a network has community structure, and whether a given guess about what these communities are yields actual *communities* (a cluster of nodes that interact more among themselves than with outsiders) is an empirical question that needs to be answered with data.
But first, we need to develop a criterion for determining whether a given partition of the network into mutually exclusive node subsets actually produces *communities* as we defined them earlier. This criterion should be independent of particular methods and algorithms that claim to find communities, so that we can compare them with one another and see whether the partitions they recommend yield actual communities.
Mark @newman06a, who has done the most influential work in this area, proposed such a criterion and called it the **modularity** of a partition (e.g., the extent to which a partition has identified the "modules" or subsets of the network).
## A bag of links
An intuitive way to understand the modularity is as follows. Imagine we have an idea of what the communities in a network are. This could be given by a special community partitioning method, our intuition, or exogenous node coloring (e.g., based on a node attribute such as race, gender, or position in the organization). The membership of each node in each community is thus stored in a vector, $C_i = k$ if node $i$ belongs to community $k$; this vector is of length $N$ where $N$ is the number of nodes in the network.
Our job is to decide whether that community partition is good, in the sense of dividing the nodes into subsets that interact preferentially with one another and not with outsiders.
One way to proceed is to imagine that we take the network in question, and we throw each observed link into a bag. Then our modularity measure should give us an idea of the probability that, if we drew a link at random, the nodes at its ends belong to the same community (or have the same color if the communities are defined by exogenous attributes). If the probability is high, then the network has a community structure. If the probability is no better than we would expect under a null model that assumes nothing is going on in the network connectivity-wise except random chance, then the modularity should be low (and we decide that the partition we chose does not divide the network into meaningful communities).
Let's assume our bag of links contains only directed links, and we draw a bunch of them at random. Let's call the node at the starting end of the link $s$ and the node at the destination end of the link $d$. Then we can measure the modularity---let's call it $Q$---of a given partition of the network into $m$ clusters as follows:
$$
Q = \sum_{k = 1}^m \left[P(s \in k \land d \in k) - P(s \in k) \times P(d \in k) \right]
$$
In this equation, $P(s \in k \land d \in k)$ is the probability that a link drawn at random has a source and a destination node that belong to the same community $k$; $P(s \in k)$ is just the probability of drawing a link that has a starting node in community $k$ (regardless of the membership of the destination node) and $P(d \in k)$ is the probability of drawing a link that has a destination node that belongs to community $k$ (regardless of the membership of the source node).
If you remember your elementary probability theory, you know that the *joint* probability of two events that are assumed to be *independent* of one another is just the product of their individual probabilities. So that means that $P(s \in k) \times P(d \in k)$ is the expected probability of finding that both the source and destination node are in the same community $k$ in a network in which communities don't matter for link formation (because the two probabilities are assumed to be independent).
So the formula for the modularity subtracts the observed probability of finding links with two nodes in the same community from what we would expect if communities didn't matter. So it measures the extent to which we find within-community links in the network beyond what we would expect by chance. Obviously, the higher this number, the higher the deviation from chance is, and the more community structure there is in the network.
Let's move to a real example. @fig-friends shows two plots of the friendship nomination network from the `law_friends` data [@lazega01] from the `networkdata` package (dropping nodes that have a degree of one). The first shows nodes colored by status within the firm (partners in orange, associates in blue), and the other shows nodes colored by gender (men in orange, women in blue).
It is pretty evident that there is more community partitioning in the network by status than by gender; that is, friendship nominations tend to go from people of a given rank to people of the same rank, which makes sense. So a measure of modularity should be higher when using status as our partition than when using gender.
```{r}
#| label: fig-friends
#| fig-cap: "Law Firm Friendship Network."
#| fig-height: 12
#| fig-width: 12
#| fig-subcap:
#| - "Nodes colored by status (Partner/Associate)."
#| - "Nodes colored by Gender (Men/Women)."
#| layout-ncol: 2
#| echo: false
library(networkdata)
library(igraph)
g <- law_friends
g <- subgraph(g, degree(g) >= 2)
set.seed(123)
l <- layout_with_kk(g)
V(g)$color <- V(g)$status
plot(g,
layout = l,
vertex.size = 6, vertex.frame.color = "lightgray",
vertex.label = NA, edge.arrow.size = 0.25,
vertex.label.dist = 1, edge.curved = 0.2
)
V(g)$color <- V(g)$gender
plot(g,
layout = l,
vertex.size = 6, vertex.frame.color = "lightgray",
vertex.label = NA, edge.arrow.size = 0.25,
vertex.label.dist = 1, edge.curved = 0.2
)
```
Let's see an example of the modularity computed using our "bag of links" framework. Below is a quick function that uses `dplyr` to take a graph as input and return an **edge list** data frame containing the "community membership" of each node for the characteristic specified by the second input.
```{r}
link.bag <- function(x, c) {
  library(dplyr)
  g.el <- as.data.frame(as_edgelist(x))
  names(g.el) <- c("vi", "vj")
  comm.dat <- data.frame(comm = as.vector(c), node = as.vector(V(x)))
  el.temp <- g.el["vj"] %>%
    left_join(comm.dat, by = c(vj = "node")) %>%
    select("vj", "comm") %>%
    rename(c2 = comm)
  d.el <- g.el["vi"] %>%
    left_join(comm.dat, by = c(vi = "node")) %>%
    select("vi", "comm") %>%
    rename(c1 = comm) %>%
    cbind(el.temp)
  return(d.el)
}
```
Here is how it works:
- Lines 1-2 declare the function, which takes a graph `x` and a community-membership vector `c` with one entry per node, and load `dplyr` for the joining and column-renaming verbs used below.
- Lines 4-5 turn the graph's ties into a data frame with one row per link and then rename the two resulting columns to `vi` (the source node) and `vj` (the target node). Line 4 wraps the edge list in `as.data.frame` because `as_edgelist` returns a matrix which don't play well with `dplyr` verbs.
- Line 7 builds the lookup table, with one row per node, pairing that node's identifier with its community label. Wrapping `c` and `V(x)` in `as.vector` makes sure the two are plain vectors that line up row for row.
- Lines 9-12 handle the *target* end of each link. Line 9 starts from the `vj` column, keeping it as a one-column data frame rather than a bare vector. Line 10 joins in each target's community, using named matching so that `vj` on the left is matched to `node` on the right; because it is a `left_join`, no links are dropped. Line 11 keeps just the target and its community, and line 12 renames that column to `c2` to mark it as the target's community.
- Lines 14-17 do the same for the *source* end, matching `vi` to `node` and naming the result `c1`. Line 18 then binds the two sides together row by row, which is safe because both were built from the same edge list and so keep the links in the same order.
- Line 20 returns the finished edge list, with columns `vi`, `c1`, `vj`, and `c2`: each link tagged with the community of both of its endpoints and ready for the modularity function below.
So if we wanted an edge list data frame containing each node's status membership in the `law_friends` network, we would just type:
```{r}
link.dat <- link.bag(g, V(g)$status)
head(link.dat)
```
Note that an edge list is already a "bag of links," so we can obtain the three probabilities we need to compute the modularity of a partition directly from the edge list data frame. Here's a function that does this:
```{r}
mod.Q1 <- function(x, c1 = 2, c2 = 4) {
  Q <- 0
  comms <- unique(x[, c1])
  for (k in comms) {
    e.same <- x[x[, c1] == k & x[, c2] == k, ]
    e.sour <- x[x[, c1] == k, ]
    e.dest <- x[x[, c2] == k, ]
    e.total <- nrow(x)
    p.same <- nrow(e.same) / e.total
    p.sour <- nrow(e.sour) / e.total
    p.dest <- nrow(e.dest) / e.total
    Q <- Q + (p.same - (p.sour * p.dest))
  }
  return(Q)
}
```
This function takes the edge list data frame as input. Optionally, you can specify the two columns containing community membership info for the source and destination nodes in each link (in this case, the second and fourth columns). The function works like this:
- Line 2 sets the running total to zero, and line 3 collects each distinct community that appears in the source column, so that we can loop over them one at a time. Taking the levels from the source column only is safe here because both status categories appear as sources; a category that showed up only as a destination would otherwise be missed.
- Lines 4-13 loop over those communities, computing each one's contribution to $Q$ and adding it on. Line 5 pulls out the links whose two endpoints are both in community $k$, line 8 counts all the links, and line 9 divides the first by the second: the probability that a link drawn at random from the bag has both ends in the same community.
- Line 10 computes the overall probability of drawing a link whose *source* node sits in community $k$, and line 11 does the same for the *destination* node. Because the two ends are treated as independent, multiplying them gives the chance we would expect if communities played no role in who links to whom.
- Line 12 takes the observed probability from line 9, subtracts that expected product, and adds the result to the running total. Doing this for every community and summing over all $m$ of them (here $m = 2$, since status has two levels) gives the modularity of the partition, which line 14 returns.
So if we wanted to check if status was more powerful in structuring the community organization of the `law_friends` network than gender, we would just type:
```{r}
mod.Q1(link.bag(g, V(g)$status))
mod.Q1(link.bag(g, V(g)$gender))
```
This indeed confirms that status is a more powerful group formation principle than gender in this network.
## Modularity from the Adjacency Matrix
Note that while the "bag of links" idea is useful for illustrating the basic probabilistic principle behind modularity in a network, we can compute it directly from the adjacency matrix without going through the edge-list data-frame construction step.
A function that does this looks like:
```{r}
mod.Q2 <- function(x, c) {
  A <- as.matrix(as_adjacency_matrix(x))
  vol <- sum(A)
  Q <- 0
  for (k in unique(c)) {
    A.sub <- A[which(c == k), which(c == k)]
    vol.k <- sum(A.sub)
    A.i <- A[which(c == k), ]
    A.j <- A[, which(c == k)]
    Q <- Q + ((vol.k / vol) - ((sum(A.i) * sum(A.j)) / vol^2))
  }
  return(Q)
}
```
This function takes a graph and a vector indicating each node's community membership, and returns the modularity. As with the bag of links, the modularity is the observed probability of a within-community link minus the probability we would expect if communities played no role. It works like this:
- Line 2 turns the graph into a plain adjacency matrix, which we need because the code below selects rows and columns by position. Line 3 counts every entry in that matrix, giving the total number of links in the network, and line 4 sets the running total to zero.
- Line 5 loops over each distinct community in `c`, so that each one's contribution can be computed and added on.
- Lines 6-7 pull out the within-community block: the rows and columns belonging to community $k$, and then the sum of every link inside it. Dividing that sum by the total from line 3 gives the share of all links that stay inside community $k$.
- Lines 8-9 take a different kind of slice. Here only *one* dimension is restricted to community $k$: line 8 keeps all rows for nodes in $k$ (every link leaving the community), and line 9 keeps all columns for nodes in $k$ (every link entering it). These are slices of the full matrix, not of the within-community block, which is why they count above and beyond the internal links.
- Line 10 combines these into community $k$'s contribution. The first term is the observed share from line 7; the second multiplies the two marginal counts and divides by the *square* of the total, which turns two counts-over-the-whole-matrix into two probabilities and then into their product---the link rate we would expect if a source's community and a destination's community had nothing to do with each other.
- Line 12 returns the accumulated total once every community has been visited, which is the modularity of that partition.
In symbols:
$$
Q = \sum_{k=1}^m \left[\frac{\sum_{i \in k} \sum_{j \in k} a_{ij}}{\sum_i \sum_j a_{ij}} - \frac{(\sum_{i \in k} \sum_j a_{ij})(\sum_i \sum_{j \in k} a_{ij})}{(\sum_i \sum_j a_{ij})^2} \right]
$$ {#eq-mod}
Where $\sum_i \sum_ja_{ij}$ is the sum of all the entries in the network adjacency matrix, $\sum_{i \in k} \sum_{j \in k} a_{ij}$ is the sum of all the entries of the sub-adjacency matrix where *both* the row and column nodes come from community $k$, $\sum_{i \in k} \sum_j a_{ij}$ is the sum of all the entries in the sub-adjacency matrix where only the row nodes come from community $k$, and $\sum_i \sum_{j \in k} a_{ij}$ is the sum of all the entries in the sub-adjacency matrix where only the column nodes come from community $k$.
We can easily see that this approach gives us the same answer as the bag of links version:
```{r}
mod.Q2(g, V(g)$status)
mod.Q2(g, V(g)$gender)
```
Of course, you don't even have to use a custom function like the above, because `igraph` has one, called (you guessed it) `modularity`:
```{r}
modularity(g, V(g)$status)
modularity(g, V(g)$gender)
```
But at least now you know what's going on inside of it!
## The Modularity Matrix
Obviously, modularity wouldn't be widely used if it were merely a way to measure the quality of a community partition produced by other methods. It can be used to find community partitions by a method that produces a node partition capturing the largest values it can take in a graph.
A useful tool in this quest is the **modularity matrix** $\mathbf{B}$ [@newman06a], which is defined as a variation on the adjacency matrix $\mathbf{A}$, where each cell of the modularity matrix $b_{ij}$ takes the value:
$$
b_{ij} = a_{ij} - \frac{k^{out}_ik^{in}_j}{\sum_i\sum_j a_{ij}}
$$
Where $k^{out}_i$ is node $i$'s outdegree and $k^{in}_j$ is node j's indegree. Note that the modularity matrix has the same "observed minus expected" structure as the formulas for the modularity. In this case, we compare whether we see a link from $i$ to $j$ as given by $a_{ij}$ against the chances of observing a link in a graph in which nodes connect at random with probability proportional to their degrees (as given by the right-hand side fraction).
Note that if the graph is undirected, the modularity matrix is just:
$$
b_{ij} = a_{ij} - \frac{k_ik_j}{\sum_i\sum_j a_{ij}}
$$
A function to compute the modularity matrix by looping through every element of the adjacency matrix for a directed graph looks like:
```{r}
mod.mat <- function(x) {
  A <- as.matrix(as_adjacency_matrix(x)) # adjacency matrix
  od <- rowSums(A) # outdegrees
  id <- colSums(A) # indegrees
  vol <- sum(A) # number of links
  n <- nrow(A) # number of nodes
  B <- matrix(0, n, n)
  for (i in 1:n) {
    for (j in 1:n) {
      B[i, j] <- A[i, j] - ((od[i] * id[j]) / vol)
    }
  }
  return(B)
}
```
It works like this:
- Line 2 converts the graph to a plain adjacency matrix so that individual entries can be picked out by position, and lines 3-4 record how many links leave each node (row sums) and how many arrive at each node (column sums). Keeping these separate matters because in a directed graph a node's outdegree and indegree rarely match.
- Line 5 counts every entry in the matrix, giving the total number of links, which is the baseline the expectations are measured against. Line 6 records the number of nodes, and line 7 sets up an empty matrix of the right size to be filled one cell at a time.
- Lines 8-10 walk over every cell of that matrix, one row and one column at a time. For each cell, line 10 compares the observed entry with what random pairing would produce: the chance that a link starts at node $i$ multiplied by the chance that it ends at node $j$, scaled by the total number of links. A positive result means the tie is more frequent than chance, a negative one means it is rarer.
- Line 13 returns the filled matrix. Because every cell is built as an observed minus expected quantity with the expected part fixed by the node's degrees, the rows and columns of the result each add up to zero.
Peeking inside the resulting matrix:
```{r}
round(mod.mat(g)[1:10, 1:10], 3)
```
Interestingly, the matrix has some negative entries, some positive entries, and some close to or actually zero. We interpret these as follows: If an entry is negative, it means that a link between the row and column nodes is much less likely to happen than expected given each node's degrees, a positive entry indicates the opposite; a larger than expected chance of a link forming. Entries close to zero indicate those nodes have odds close to a random chance of forming a tie.
Of course, `igraph` has a function, called `modularity_matrix`, which gives us the same result:
```{r}
B <- modularity_matrix(g)
round(B[1:10, 1:10], 3)
```
In the case of an undirected graph, computing the modularity is even simpler:
```{r}
mod.mat.u <- function(x) {
  A <- as.matrix(as_adjacency_matrix(x))
  d <- rowSums(A) # degrees
  vol <- sum(A)
  n <- nrow(A)
  B <- A - (d %*% t(d) / vol)
  return(B)
}
```
Let's see the function in action:
```{r}
ug <- as_undirected(g, mode = "collapse")
Bu <- mod.mat.u(ug)
round(Bu[1:10, 1:10], 2)
```
Which gives us the same results as using `igraph`:
```{r}
Bu <- modularity_matrix(ug, directed = FALSE)
round(Bu[1:10, 1:10], 2)
```
The modularity matrix has some interesting properties. For instance, *both* its rows and columns sum to zero:
```{r}
round(rowSums(Bu), 2)
round(colSums(Bu), 2)
```
Which makes $\mathbf{B}$ **doubly centered** a neat but so far useless property.
## Using the Modularity Matrix to Find the Modularity of a Partition
A more interesting property of the modularity matrix is that we can use it to compute the actual modularity of a given binary partition of the network into clusters. Let's take status in the `law_friends` network as an example.
First, we create a new vector $\mathbf{s}$ that equals one when node $i$ is in the first group (partners) and minus one when node $i$ is in the second group (associates):
```{r}
s.contrast <- V(g)$status
s.contrast[which(s.contrast == 1)] <- 1
s.contrast[which(s.contrast == 2)] <- -1
s.contrast
```
Once we have this vector, the modularity is just:
$$
Q = \frac{\mathbf{s}^T\mathbf{B}\mathbf{s}}{2\sum_i\sum_ja_{ij}}
$$
Which we can readily check in `R`:
```{r}
A <- as.matrix(as_adjacency_matrix(g))
as.numeric(t(s.contrast) %*% B %*% s.contrast) / (2 * sum(A))
```
You can think of the $\mathbf{s}$ vector as identifying the binary community membership via **contrast coding**.
We can also use the modularity matrix to find the modularity of a partition via **dummy coding**. To do this, we create two vectors for each level of the group membership variable with $u^{(1)}_i = 1$ when node $i$ is a partner (otherwise $u^{(1)}_i = 0$), and $u^{(2)}_i = 1$ when node $i$ is an associate (otherwise $u^{(2)}_i = 0$).
In `R`, we can do this as follows:
```{r}
u1 <- rep(0, length(V(g)$status))
u2 <- rep(0, length(V(g)$status))
u1[which(V(g)$status == 1)] <- 1
u2[which(V(g)$status == 2)] <- 1
```
We then join the two vectors into a matrix $\mathbf{U}$ of dimensions $n \times 2$:
```{r}
U <- cbind(u1, u2)
head(U)
tail(U)
```
Once we have this matrix, the modularity of the partition is given by:
$$
\frac{tr(U^TBU)}{\sum_i\sum_ja_{ij}}
$$
Where $tr$ denotes the **trace** operation in a matrix, namely, taking the sum of its diagonal elements.
We can check that this gives us the correct solution in `R` as follows:
```{r}
sum(diag(t(U) %*% B %*% U)) / sum(A)
```
Neat! It makes sense (given the name of the matrix) that we can compute the modularity from $\mathbf{B}$, and we can do it in multiple ways.
## Using the Modularity Matrix to Find Communities
Here's an even more useful property of the modularity matrix. Remember the network distribution game we played to define our various reflective status measures in our discussion of [prestige](prest-eigen.qmd)?
```{r}
status1 <- function(w) {
  x <- rep(1, nrow(w)) # initial status vector set to all ones of length equal to the number of nodes
  d <- 1 # initial delta
  k <- 0 # initializing counter
  while (d > 1e-10) {
    o.x <- x # old status scores
    x <- w %*% o.x # new scores are a function of old scores and adjacency matrix
    x <- x / norm(x, type = "E") # normalizing new status scores
    d <- abs(sum(abs(x) - abs(o.x))) # delta between new and old scores
    k <- k + 1 # incrementing while counter
  }
  return(as.vector(x))
}
```
What if we played it with the modularity matrix?
```{r}
s.eig <- status1(Bu)
round(s.eig, 2)
```
This seems more interesting. The resulting "status" vector has both negative and positive entries. What if I told you that this vector is actually a **partition** of the original graph into two communities?
Not only that, I have even better news. This is the partition that *maximizes* the modularity in the graph, the best two-group partition that has the most edges within groups and the least edges going across groups.^[Actually, this is not true; finding the partition that maximizes the modularity in a graph is an NP hard problem [@brandes07], so this is just a pretty good approximation of that.]
Let's see some evidence for these claims in real data.
First, let's turn the "status" vector into a community indicator vector. We assign all nodes with scores larger than zero to one community and nodes with scores equal to zero or less to the other one:
```{r}
C <- rep(0, length(s.eig))
C[which(s.eig <= 0)] <- 1
C[which(s.eig > 0)] <- 2
names(C) <- 1:length(C)
C
```
And for the big check:
```{r}
modularity(ug, C)
```
This is a pretty big score, at least larger than we obtained earlier using the exogenous indicator of status in the law firm as the basis for a binary partition. @fig-mod-1 shows visual evidence that this is indeed an optimal binary partition of the `law_friends` network.
Of course, you may also remember from the [Status and Prestige](prest-eigen.qmd) lesson that the little status game we played above is also a method (called the "power" method) of computing the **leading eigenvector** (the one associated with the largest eigenvalue) of a matrix. So turns out that the modularity maximizing bi-partition of a graph is just given by this vector:
$$
\mathbf{B}\mathbf{v} = \lambda\mathbf{v}
$$ {#eq-mod-eig}
Solving for $\mathbf{v}$ in @eq-mod-eig yields the nodes' community memberships. In `R`, you can do this using the native `eigen` function as we did for the status scores:
```{r}
v <- eigen(Bu)$vectors[, 1]
round(v, 2)
```
Which look like the same values we obtained earlier.
We can package all of the steps above into a simple function:
```{r}
split.two <- function(x) {
  e <- eigen(x)$vectors[, 1]
  v <- rep(0, length(e))
  v[e <= 0] <- 1
  v[e > 0] <- 2
  names(v) <- 1:length(v)
  c1 <- rep(0, length(v))
  c2 <- rep(0, length(v))
  c1[which(v == 1)] <- 1
  c2[which(v == 2)] <- 1
  dummy <- cbind(c1, c2)
  return(list(v = v, dummy = dummy))
}
```
It works like this:
- Line 1 defines a function whose input, despite the graph-flavored examples around it, is a *matrix*---in practice the modularity matrix. Line 2 pulls out its leading eigenvector, the vector tied to the largest eigenvalue, whose entries serve as each node's score.
- Lines 3-5 turn those scores into a two-group label. A vector of zeros is created to hold the labels, then nodes with a non-positive score are given the label 1 and nodes with a positive score the label 2. Note that the sign of an eigenvector is arbitrary, so the computer may return the mirror image of the same vector and swap which group gets which label; the partition itself is unaffected.
- Line 6 names the labels after node positions, so the result lines up with the vertex order of the graph rather than with an arbitrary order.
- Lines 7-10 build the same partition in **dummy** form: two columns of zeros and ones, one for each group, marking which nodes belong to it. This second version is needed because the trace-based formula for modularity takes an indicator matrix rather than a single label vector.
- Line 12 returns both versions in a named list, since the divisive routine below uses the scalar labels to describe the split and the indicator matrix to evaluate its modularity.
And check to see if it works:
```{r}
split.two(Bu)$v
```
Indeed, it splits the nodes in a graph into two modularity-maximizing communities.
It is clear that this approach hints at a divisive partitioning strategy, where we begin with two communities and then try to split one (or both) of those communities into two more, as with CONCOR.
However, unlike CONCOR, we don't want to be unprincipled here because splitting a well-defined community into two just for the hell of it can actually lead to *worse* modularity than keeping the original larger communities.
So we need an approach that *tries out* splitting one of the original two communities into two smaller ones, checks the new modularity, compares it with the old, and only proceeds with the partition if the new modularity is greater than the old.
Here's one way of doing that:
```{r}
split.mult <- function(B, vol, u, v, s = 0.01) {
  split <- list()
  delta.Q <- rep(0, max(v))
  for (i in 1:max(v)) {
    old.Q <- t(u[, i]) %*% B %*% u[, i] # Using dummy coding to compute Q
    sub <- which(u[, i] == 1)
    new.B <- B[sub, sub]
    new.u <- split.two(new.B)$dummy
    new.v <- split.two(new.B)$v
    Q1 <- t(new.u[, 1]) %*% new.B %*% new.u[, 1] # Using dummy coding to compute Q
    Q2 <- t(new.u[, 2]) %*% new.B %*% new.u[, 2] # Using dummy coding to compute Q
    new.Q <- Q1 + Q2
    delta.Q[i] <- (new.Q - old.Q) * (1 / vol)
    if (delta.Q[i] > s) {
      split[[i]] <- new.v
      names(split[[i]]) <- which(u[, i] == 1)
    } else if (delta.Q[i] <= s) {
      split[[i]] <- NULL
    }
  }
  return(list(delta.Q = round(delta.Q, 3), v = v, split = split))
}
```
This function uses the output of the `split.two` function to check whether either of the current communities should be split into two further sub-communities, by comparing the modularity before and after the proposed split. It works like this:
- Line 1 takes the modularity matrix `B`, the total number of links `vol` (needed to put the matrix-based score back on the modularity scale), the dummy indicator matrix `u` for the current communities, the current labels `v`, and a minimum improvement `s`, which defaults to 0.01.
- Lines 2-4 set up the machinery: an empty list to hold any splits that get accepted, one slot per community, a vector of zeros to record each community's change in modularity, and a loop that visits each community in turn.
- Line 5 computes the current modularity for community `i`. This uses the same trace formula as before, applied to that community's indicator column, but without dividing by the total number of links. That division is deferred to line 13, where it is applied once to the *difference* instead.
- Lines 6-7 restrict attention to the part of the matrix that the split could possibly change. Line 6 finds the nodes belonging to community `i`, and line 7 takes the square block made of just those rows and columns; links to nodes outside the community are untouched by subdividing it, so they can be ignored.
- Lines 8-12 run the eigenvector split on that block and score the result. The block is split into two candidate sub-communities, and the two halves' modularities are computed and added together, giving the modularity the partition would have if this split were adopted.
- Lines 13-19 compare the new modularity with the old one, scaled by the total number of links. If the gain exceeds the threshold `s`, the split is kept and its labels are re-attached to the original node numbers so they line up with the graph; otherwise nothing is stored for that community, so it is left alone (assigning `NULL` to a list element in R removes it rather than adding a blank slot). Line 21 returns the per-community changes, the unchanged labels, and the list of accepted splits.
Here are the results applied to the `law_friends` network:
```{r}
splits1 <- split.mult(
  B = Bu,
  vol = sum(as.matrix(as_adjacency_matrix(ug))),
  u = split.two(Bu)$dummy,
  v = split.two(Bu)$v
)
splits1
```
The `delta.Q` vector stores the results of our modularity checks. In this case, the test in the first community failed; the modularity didn't change (the difference between the old and the new is zero) when we tried to split into two smaller communities. This is usually indicative that the original community was a well-defined **group** with lots of within-cluster ties, so that splitting it makes no difference (that's the orange nodes in @fig-mod-1 below).
Nevertheless, the test in the second community was positive, indicating we should split it into two. Because we left one of the original communities alone, the resulting network will have three communities after splitting the second one in two.
Note that the function returns the original two-split named vector of community assignments `v`, a `NULL` result for the first split, and a new vector assigning nodes in the second original split to two other communities (`split[[2]]`).
We now create a new three-community vector from these results:
```{r}
splits1$v[as.numeric(names(splits1$split[[2]]))] <- splits1$split[[2]] + 1
splits1$v
```
@fig-mod-2 shows the results of the three-community partition.
Now let's say we wanted to check if we should *further* split any of these three communities into two. All we need to do is create "dummy" variables for the new three community partition and feed these (and the three community membership vector) to the `split.mult` function, while keeping *the original* modularity matrix [@newman06b]:
```{r}
c1 <- rep(0, length(splits1$v))
c2 <- rep(0, length(splits1$v))
c3 <- rep(0, length(splits1$v))
c1[which(splits1$v == 1)] <- 1
c2[which(splits1$v == 2)] <- 1
c3[which(splits1$v == 3)] <- 1
dummies <- cbind(c1, c2, c3)
splits2 <- split.mult(
  B = Bu,
  vol = sum(as.matrix(as_adjacency_matrix(ug))),
  u = dummies,
  v = splits1$v
)
splits2
```
Here, the three modularity-split checks failed, as indicated by the `delta.Q` vector. So no further splits were made (hence the `split` object is an empty list). This tells us that, according to this method, three communities are the optimal partition.
Of course, if you are working on your project, you don't have to mess with all of the functions above, because `igraph` has implemented Newman's leading eigenvector (of the modularity matrix) community detection method [@newman06b] in a single function called `cluster_leading_eigen`.
To use it, just feed it the relevant graph:
```{r}
le.res <- cluster_leading_eigen(ug)
```
And examine the `membership` object stored in the results list:
```{r}
names(le.res$membership) <- 1:length(le.res$membership)
le.res$membership
```
Which returns nearly identical community assignments as above (with the labels between communities 2 and 3 flipped, and a single node classified differently).
## Communities versus Exogenous Attributes
Remember, we began this discussion using an exogenous criterion (law firm status as partner or associate) to examine the network's community structure (which performs pretty well according to modularity). But now we have also used a pure link-based approach to finding communities. How do they compare? Here's a way to find out:
```{r}
library(kableExtra)
t <- table(V(ug)$status, le.res$membership)
kbl(t, row.names = TRUE, align = "c", format = "html") %>%
  column_spec(1, bold = TRUE) %>%
  kable_styling(
    full_width = TRUE,
    bootstrap_options = c("hover", "condensed", "responsive")
  )
```
This is just a **contingency table** listing status in the rows (1 = partner) and the three leading eigenvector communities in the columns.
We find that community one (the most coherent, in orange) is `r round((1 - 3/30)*100)`% partners (it contains `r sum(t[, 1])` members, of whom only `r t[2, 1]` are associates). So it is a high-status clique. Community three (in blue), on the other hand, is composed entirely of associates, a less dense but completely homogeneous, low-status clique. Finally, community two (green) is a status-mixed clique, composed of nine partners and seven associates.
So in this network, both status and endogenous group dynamics seem to be at play.
## An Agglomerative Approach Based on the Modularity
The leading eigenvector approach discussed above is a **divisive** clustering algorithm. All nodes begin in one community; we split into two, then try to split one of those two into two others (if the modularity increases), and so forth.
But as we noted in the [previous handout](sim-structequiv.qmd), another way to cluster is *bottom up*. All nodes begin in their own singleton cluster, and we join nodes if they maximize some criterion, in this case, the modularity. We then join new nodes to that group. If they increase the modularity, we try other joins, merging communities as we go, until we can't increase it any further.
This **agglomerative** approach to clustering is not guaranteed to reach a global maximum, but it can work in most applied settings, even at the risk of getting stuck in a local optimum.
@newman04 developed a fast agglomerative algorithm that optimizes the modularity, a more recent version of which is included in an `igraph` function called `cluster_fast_greedy` [@clauset_etal04].
Let's try it out to see how it works:
```{r}
fg.res <- cluster_fast_greedy(ug)
```
Before looking at what `igraph` barfs back, it is worth looking at the "greedy" part itself, since that's the conceptually important part (the "fast" is just optimization stuff for large networks).
The Newman agglomerative approach works as follows. At each stage we ask which pair of current communities, if merged, would raise the modularity the most, and we make that merge. The gain from merging two groups turns out to be a simple quantity: the sum of the modularity-matrix entries that fall between them, divided by the total number of links.
Here's a function that does that:
```{r}
greedy <- function(x) {
  B <- mod.mat(x)
  m <- ecount(x)
  comm <- 1:nrow(B) # every node starts in its own community
  repeat {
    best <- 0
    pair <- NULL
    for (i in unique(comm)) {
      for (j in unique(comm)) {
        if (i < j) {
          d <- sum(B[comm == i, comm == j]) / m # gain in modularity from merging i and j
          if (d > best) { # if best merge so far
            best <- d  # replace best
            pair <- c(i, j) # record the pair of communities the best gain came from
          }
        }
      }
    }
    if (is.null(pair)) break # no merge improved modularity
    comm[comm == pair[2]] <- pair[1] # merge community j into i from the best remaining gain
  }
  return(comm)
}
```
It works like this:
- Lines 1-4 take a graph as input, compute the modularity matrix (`B`), store the number of edges in the graph in object `m`, and give every node a unique label (a number between 1 and $N$ where $N$ is the number of nodes) stored in the `comm` vector. Because the algorithm is agglomerative, every node starts in a community of one.
- Lines 5-7 and 19 control how long the merging continues. The `repeat` loop keeps going until a full pass finds no improving pair which means that `pair` remains set to `NULL`. The object `best` records the largest gain seen so far in the `for` loop and `pair` the two communities that gain came from.
- Lines 8-9 loop over every pair of current communities (note we use `unique` on the `comm` vector because it will eventually contain repeated values for nodes assigned to the same community). Because the modularity matrix is symmetric in this case of an undirected graph, the condition on line 10 restricts the scan to pairs with `i < j`, so each unordered pair of communities is visited once rather than twice.
- Line 11 scores a candidate merge as the sum of the matrix entries lying between the two groups, divided by the total number of links. Because line 10 reads only one of the two symmetric blocks, that sum is half the total weight between the groups, but the denominator is also half the matrix's own scale: the modularity matrix divides by the sum of all entries, which for an undirected graph is twice the number of edges.
- Lines 12-14 keep the pair with the largest positive gain, and line 20 makes that merge by relabelling every node in the second community with the label of the first. When no pair clears zero, line 22 returns the labels.
The result matches `igraph` exactly---the same three communities and the same modularity:
```{r}
gr.res <- greedy(ug)
modularity(ug, gr.res)
modularity(ug, fg.res$membership)
```
The difference between our little function above and the `igraph` version is speed (not particularly noticeable in a small network like our example). The `igraph` version keeps the candidate gains in a heap and updates only the pairs affected by each merge, instead of rescanning every pair after every merge; that change in bookkeeping efficiency is what the "fast" in `cluster_fast_greedy` refers to.
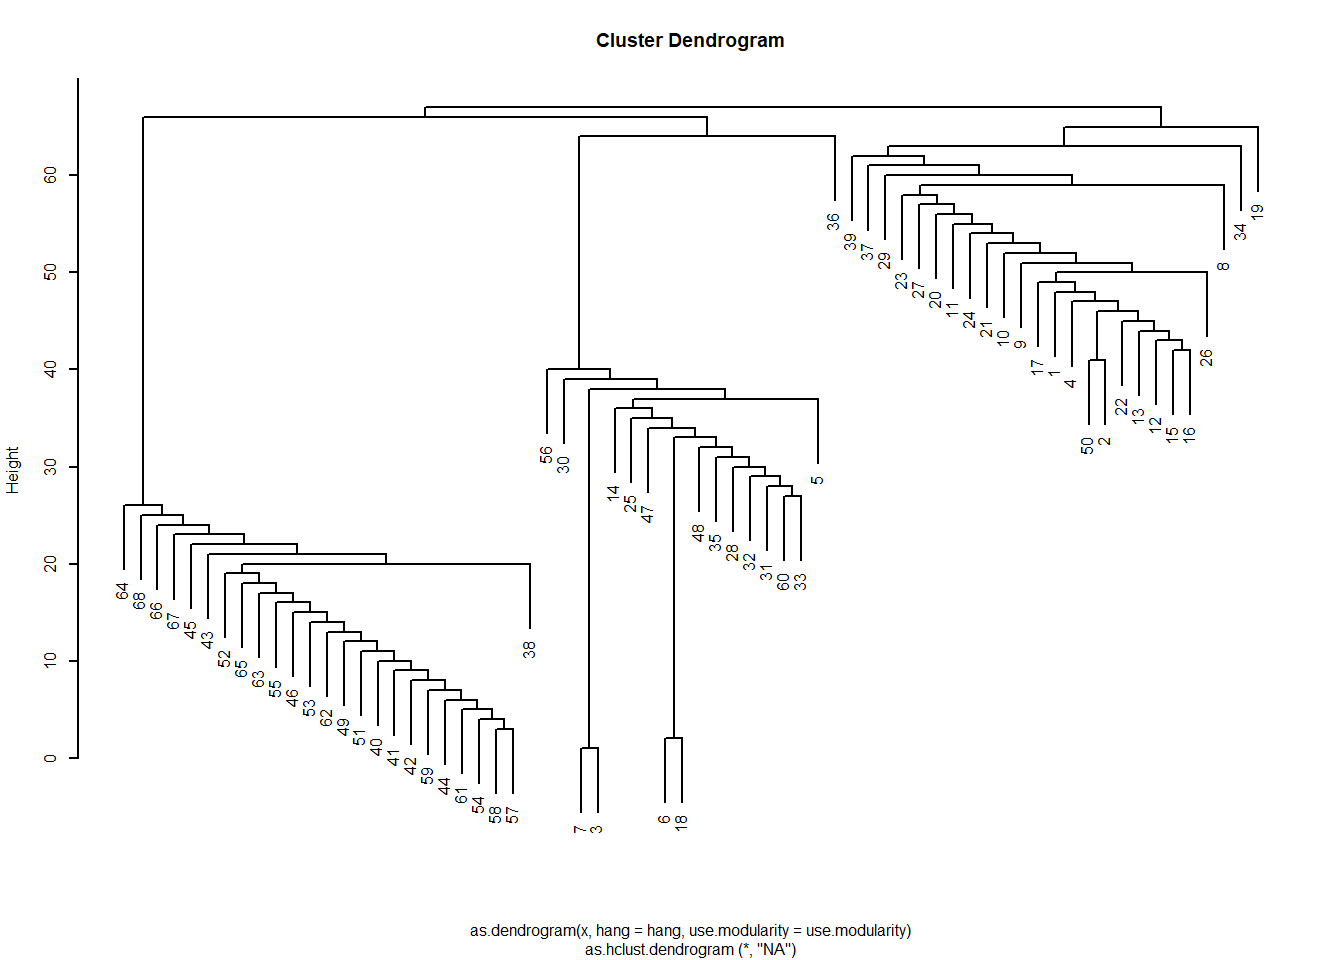
The resulting `fg.res` list object in `igraph` has various sub-objects as components. One of them is called `merges`, which provides a history of the various merges that led to the final communities. This means we can view the results as a **dendrogram**, just as we did with structural similarity analyses based on hierarchical clustering of a distance matrix.
To do this, we just transform the resulting object into an `hclust` object and plot:
```{r}
hc <- as.hclust(fg.res)
par(cex = 0.5) # smaller labels
plot(hc)
```
This gives us the sense that the network is divided into three communities, as we saw earlier. If we wanted to see which nodes are in which, we could just cut the dendrogram at $k = 3$:
```{r}
library(dendextend)
cutree(hc, k = 3)
```
This provides the relevant assignment to communities (if we wanted more communities, we would cut the tree at a lower height).
Of course, this information was already stored in our results in the `membership` object:
```{r}
names(fg.res$membership) <- 1:length(fg.res$membership)
fg.res$membership
```
```{r}
#| label: fig-mod
#| fig-height: 12
#| fig-width: 12
#| fig-subcap:
#| - "Law Firm Friendship Network by The Best Binary Partition Using the Leading Eigenvector of the Modularity Matrix Approach."
#| - "Law Firm Friendship Network by The Best Three-Community Partition Using the Leading Eigenvector of the Modularity Matrix Approach."
#| - "Law Firm Friendship Network by The Best Three-Community Partition Using the Fast-Greedy Modularity Maximization Approach."
#| layout-ncol: 2
#| echo: false
set.seed(123)
ul <- layout_with_kk(ug)
V(ug)$color <- C
plot(ug,
layout = ul,
vertex.size = 6, vertex.frame.color = "lightgray",
vertex.label = NA, edge.arrow.size = 0.25,
vertex.label.dist = 1, edge.curved = 0.2
)
V(ug)$color <- splits2$v
plot(ug,
layout = ul,
vertex.size = 6, vertex.frame.color = "lightgray",
vertex.label = NA, edge.arrow.size = 0.25,
vertex.label.dist = 1, edge.curved = 0.2
)
V(ug)$color <- fg.res$membership
plot(ug,
layout = ul,
vertex.size = 6, vertex.frame.color = "lightgray",
vertex.label = NA, edge.arrow.size = 0.25,
vertex.label.dist = 1, edge.curved = 0.2
)
```
@fig-mod-3 visualizes the resulting three-community partition, which is pretty close to what we got using the leading eigenvector method.